TCF Bank 2011 Annual Report Download - page 48
Download and view the complete annual report
Please find page 48 of the 2011 TCF Bank annual report below. You can navigate through the pages in the report by either clicking on the pages listed below, or by using the keyword search tool below to find specific information within the annual report.-
 1
1 -
2
-
3
-
4
-
5
-
6
-
7
-
8
-
9
-
10
-
11
-
12
-
13
-
14
-
15
-
16
-
17
-
18
-
19
-
20
-
21
-
22
-
23
-
24
-
25
-
26
-
27
-
28
-
29
-
30
-
31
-
32
-
33
-
34
-
35
-
36
-
37
-
 38
38 -
 39
39 -
 40
40 -
 41
41 -
 42
42 -
 43
43 -
 44
44 -
 45
45 -
 46
46 -
 47
47 -
 48
48 -
 49
49 -
 50
50 -
 51
51 -
 52
52 -
 53
53 -
 54
54 -
 55
55 -
 56
56 -
 57
57 -
 58
58 -
59
-
60
-
61
-
62
-
63
-
64
-
65
-
66
-
67
-
68
-
69
-
70
-
71
-
72
-
73
-
74
-
75
-
76
-
77
-
78
-
79
-
80
-
81
-
82
-
83
-
84
-
85
-
86
-
87
-
88
-
89
-
90
-
91
-
92
-
93
-
94
-
95
-
96
-
97
-
98
-
99
-
100
-
101
-
102
-
103
-
104
-
105
-
106
-
107
-
108
-
109
-
110
-
111
-
112
-
113
-
114
-
115
-
116
-
117
-
118
-
119
-
120
-
121
-
122
-
123
-
124
-
125
-
126
-
127
-
128
-
129
-
130
-
131
-
132
-
133
-
134
-
135
-
136
-
137
-
138
-
139
-
140
 |
 |

The determination of current and deferred income taxes
is a critical accounting estimate which is based on complex
analyses of many factors including interpretation of
income tax laws, the evaluation of uncertain tax positions,
differences between the tax and financial reporting basis
of assets and liabilities (temporary differences), estimates
of amounts due or owed such as the timing of reversal of
temporary differences and current financial accounting
standards. Additionally, there can be no assurance that
estimates and interpretations used in determining income
tax liabilities may not be challenged by taxing authorities.
Actual results could differ significantly from the estimates
and tax law interpretations used in determining the current
and deferred income tax liabilities.
In addition, under generally accepted accounting
principles, deferred income tax assets and liabilities are
recorded at the income tax rates expected to apply to
taxable income in the periods in which the deferred income
tax assets or liabilities are expected to be realized. If such
rates change, deferred income tax assets and liabilities
must be adjusted in the period of change through a charge
or credit to the Consolidated Statements of Income. Also,
if current period income tax rates change, the impact on
the annual effective income tax rate is applied year-to-
date in the period of enactment.
Consolidated Financial Condition Analysis
Securities Available for Sale Securities available for
sale were $2.3 billion, or 12.2% of total assets, at December
31, 2011. TCF’s securities available for sale portfolio
primarily consists of fixed-rate mortgage-backed securities
issued by Fannie Mae and Freddie Mac. Net unrealized
pre-tax gains on securities available for sale totaled $88.8
million at December 31, 2011, compared with unrealized
pre-tax losses of $25.8 million at December 31, 2010. TCF
may, from time to time, sell treasury and agency securities
and utilize the proceeds to reduce borrowings, fund growth
in loans and leases or for other corporate purposes.
TCF’s securities portfolio does not contain commercial
paper, asset-backed commercial paper or asset-backed
securities secured by credit cards or auto loans. TCF also
has not participated in structured investment vehicles.
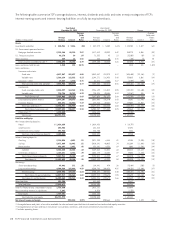
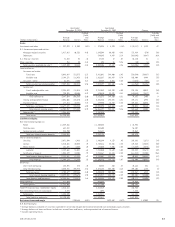
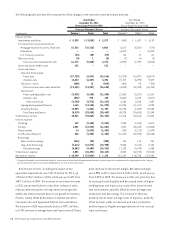
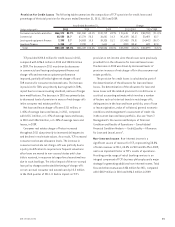
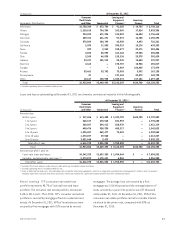
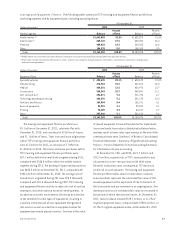
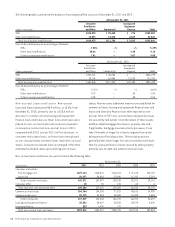
Loans and Leases The following tables set forth information about loans and leases held in TCF’s portfolio.
Year Ended December 31,
Compound Annual
Growth Rate
(Dollars in thousands) 2011 2010 2009 2008 2007
1-Year
2011/2010
5-Year
2011/2006
Consumer real estate and other:
Consumer real estate:
First mortgage lien $ 4,742,423 $ 4,893,887 $ 4,961,347 $ 4,881,662 $ 4,706,568 (3.1)% 1.5%
Junior lien 2,152,868 2,262,194 2,319,222 2,420,116 2,344,113 (4.8) .5
Total consumer real estate 6,895,291 7,156,081 7,280,569 7,301,778 7,050,681 (3.6) 1.2
Other 38,513 39,188 51,422 62,561 223,691 (1.7) (28.6)
Total consumer real estate
and other 6,933,804 7,195,269 7,331,991 7,364,339 7,274,372 (3.6) .6
Commercial real estate 3,198,698 3,328,216 3,269,003 2,984,156 2,557,330 (3.9) 6.0
Commercial business 250,794 317,987 449,516 506,887 558,325 (21.1) (14.6)
Total commercial 3,449,492 3,646,203 3,718,519 3,491,043 3,115,655 (5.4) 3.2
Leasing and equipment finance (1) 3,142,259 3,154,478 3,071,429 2,486,082 2,104,343 (.4) 11.6
Inventory finance 624,700 792,354 468,805 4,425 – (21.2) N.M.
Total loans and leases $14,150,255 $14,788,304 $14,590,744 $13,345,889 $12,494,370 (4.3) 4.3
N.M. Not Meaningful.
(1) Excludes operating leases included in other assets.
30 TCF Financial Corporation and Subsidiaries