TCF Bank 2011 Annual Report Download - page 42
Download and view the complete annual report
Please find page 42 of the 2011 TCF Bank annual report below. You can navigate through the pages in the report by either clicking on the pages listed below, or by using the keyword search tool below to find specific information within the annual report.-
 1
1 -
2
-
3
-
4
-
5
-
6
-
7
-
8
-
9
-
10
-
11
-
12
-
13
-
14
-
15
-
16
-
17
-
18
-
19
-
20
-
21
-
22
-
23
-
24
-
25
-
26
-
27
-
28
-
29
-
30
-
31
-
 32
32 -
 33
33 -
 34
34 -
 35
35 -
 36
36 -
 37
37 -
 38
38 -
 39
39 -
 40
40 -
 41
41 -
 42
42 -
 43
43 -
 44
44 -
 45
45 -
 46
46 -
 47
47 -
 48
48 -
 49
49 -
 50
50 -
 51
51 -
 52
52 -
53
-
54
-
55
-
56
-
57
-
58
-
59
-
60
-
61
-
62
-
63
-
64
-
65
-
66
-
67
-
68
-
69
-
70
-
71
-
72
-
73
-
74
-
75
-
76
-
77
-
78
-
79
-
80
-
81
-
82
-
83
-
84
-
85
-
86
-
87
-
88
-
89
-
90
-
91
-
92
-
93
-
94
-
95
-
96
-
97
-
98
-
99
-
100
-
101
-
102
-
103
-
104
-
105
-
106
-
107
-
108
-
109
-
110
-
111
-
112
-
113
-
114
-
115
-
116
-
117
-
118
-
119
-
120
-
121
-
122
-
123
-
124
-
125
-
126
-
127
-
128
-
129
-
130
-
131
-
132
-
133
-
134
-
135
-
136
-
137
-
138
-
139
-
140
 |
 |

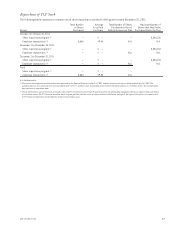
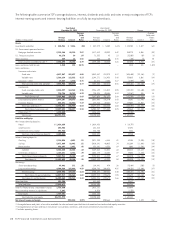
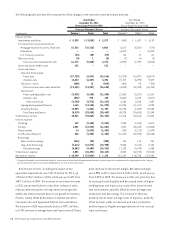
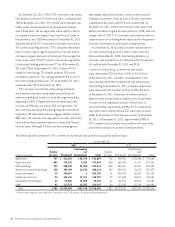
The following table presents the components of the changes in net interest income by volume and rate.
Year Ended
December 31, 2011
Versus Same Period in 2010
Year Ended
December 31, 2010
Versus Same Period in 2009
Increase (Decrease) Due to Increase (Decrease) Due to
(In thousands) Volume(1) Rate(1) Total Volume(1) Rate(1) Total
Interest income:
Investments and other $ 5,355 $ (3,028) $ 2,327 $ (480) $ 1,619 $ 1,139
U.S. Government sponsored entities:
Mortgage-backed securities, fixed rate 15,522 (10,716) 4,806 8,017 (8,587) (570)
Debentures – – – (8,487) – (8,487)
U.S. Treasury securities (24) (35) (59) 64 17 81
Other securities (8) 2 (6) (2) (4) (6)
Total securities available for sale 14,171 (9,428) 4,743 (6,990) (1,992) (8,982)
Loans and leases held for sale 131 – 131 – – –
Loans and leases:
Consumer home equity:
Fixed-rate (27,755) (4,391) (32,146) (21,230) (13,597) (34,827)
Variable-rate 12,443 (6,347) 6,096 15,747 (6,298) 9,449
Consumer — other (600) 12 (588) (803) 45 (758)
Total consumer real estate and other (13,151) (13,487) (26,638) (3,853) (22,283) (26,136)
Commercial:
Fixed- and adjustable-rate (5,992) (5,658) (11,650) 12,846 (2,827) 10,019
Variable-rate (832) 970 138 (5,687) 3,070 (2,617)
Total commercial (6,740) (4,772) (11,512) 4,154 3,248 7,402
Leasing and equipment finance 1,165 (13,160) (11,995) 15,096 (11,101) 3,995
Inventory finance 12,903 (1,201) 11,702 36,778 (1,694) 35,084
Total loans and leases (8,915) (29,528) (38,443) 45,028 (24,683) 20,345
Total interest income 38,821 (70,063) (31,242) 31,118 (18,616) 12,502
Interest expense:
Checking 129 (2,144) (2,015) 1,093 (2,764) (1,671)
Savings 1,851 (12,932) (11,081) 7,507 (26,040) (18,533)
Money market 14 (1,595) (1,581) (261) (2,213) (2,474)
Certificates of deposit 460 (1,904) (1,444) (16,107) (22,098) (38,205)
Borrowings:
Short-term borrowings (264) (39) (303) 131 110 241
Long-term borrowings (3,614) (12,374) (15,988) 9,556 (3,414) 6,142
Total borrowings (6,802) (9,489) (16,291) 11,123 (4,740) 6,383
Total interest expense 4,081 (36,493) (32,412) 8,230 (62,730) (54,500)
Net interest income $ 28,190 $ (27,020) $ 1,170 $ 21,274 $ 45,728 $ 67,002
(1) Changes attributable to the combined impact of volume and rate have been allocated proportionately to the change due to volume and the change due to rate. Changes
due to volume and rate are calculated independently for each line item presented.
Net interest income, including the impact of tax
equivalent adjustments, was $701.8 million for 2011, up
.2% from $700.7 million in 2010, which was up 10.6% from
$633.7 million in 2009. The increase in net interest income
in 2011 was primarily due to reductions in deposit rates,
reduced interest expense on long-term borrowings and
additional interest earned due to loan growth in inventory
finance, mostly offset by decreases in interest earned on
consumer loans and equipment finance loans and leases.
The increase in 2010 was primarily due to a $739.1 million,
or 5.3%, increase in average loans and leases and a 28 basis
point increase in net interest margin. Net interest margin
was 3.99% in 2011, down from 4.15% in 2010, which was up
from 3.87% in 2009. The decrease in 2011 was primarily due
to increased asset liquidity and decreased levels of higher
yielding loans and leases as a result of the lower interest
rate environment, partially offset by lower average cost
of deposits and borrowings. The increase in 2010 was
primarily due to lower average costs of deposits, partially
offset by lower yields on new loan and lease production
and the impact of higher average balances of non-accrual
loans and leases.
24 TCF Financial Corporation and Subsidiaries