TCF Bank 2011 Annual Report Download - page 50
Download and view the complete annual report
Please find page 50 of the 2011 TCF Bank annual report below. You can navigate through the pages in the report by either clicking on the pages listed below, or by using the keyword search tool below to find specific information within the annual report.-
 1
1 -
2
-
3
-
4
-
5
-
6
-
7
-
8
-
9
-
10
-
11
-
12
-
13
-
14
-
15
-
16
-
17
-
18
-
19
-
20
-
21
-
22
-
23
-
24
-
25
-
26
-
27
-
28
-
29
-
30
-
31
-
32
-
33
-
34
-
35
-
36
-
37
-
38
-
39
-
 40
40 -
 41
41 -
 42
42 -
 43
43 -
 44
44 -
 45
45 -
 46
46 -
 47
47 -
 48
48 -
 49
49 -
 50
50 -
 51
51 -
 52
52 -
 53
53 -
 54
54 -
 55
55 -
 56
56 -
 57
57 -
 58
58 -
 59
59 -
 60
60 -
61
-
62
-
63
-
64
-
65
-
66
-
67
-
68
-
69
-
70
-
71
-
72
-
73
-
74
-
75
-
76
-
77
-
78
-
79
-
80
-
81
-
82
-
83
-
84
-
85
-
86
-
87
-
88
-
89
-
90
-
91
-
92
-
93
-
94
-
95
-
96
-
97
-
98
-
99
-
100
-
101
-
102
-
103
-
104
-
105
-
106
-
107
-
108
-
109
-
110
-
111
-
112
-
113
-
114
-
115
-
116
-
117
-
118
-
119
-
120
-
121
-
122
-
123
-
124
-
125
-
126
-
127
-
128
-
129
-
130
-
131
-
132
-
133
-
134
-
135
-
136
-
137
-
138
-
139
-
140
 |
 |

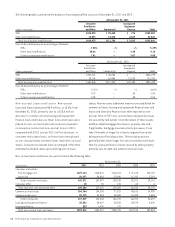
At December 31, 2011, 74% of TCF’s consumer real estate
loan balance consisted of closed-end loans, compared with
75% at December 31, 2010. TCF’s closed-end consumer real
estate loans require payments of principal and interest
over a fixed term. The average home value, which is based
on original values securing the loans and lines of credit in
this portfolio, was $258 thousand as of December 31, 2011.
Substantially all of TCF’s consumer real estate loans are in
TCF’s primary banking markets. TCF’s consumer real estate
lines of credit require regular payments of interest and do
not require regular payments of principal. The average Fair
Isaac Corporation (“FICO”) credit score at loan origination
for the retail lending portfolio was 727 as of December 31,
2011 and 726 as of December 31, 2010. As part of TCF’s
credit risk monitoring, TCF obtains updated FICO score
information quarterly. The average updated FICO score for
the retail lending portfolio was 727 at December 31, 2011,
compared with 725 at December 31, 2010.
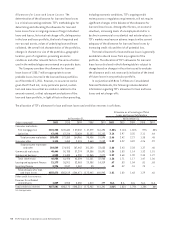
TCF’s consumer real estate underwriting standards
are intended to produce adequately secured loans to
customers with good credit scores at the origination date.
Beginning in 2008, TCF generally has not made new loans
in excess of 90% loan-to-value (LTV) at origination. TCF
does not have any subprime lending programs and did not
originate 2/28 adjustable-rate mortgages (ARM) or Option
ARM loans. TCF also has not originated consumer real estate
loans with multiple payment options or loans with “teaser”
interest rates. Although TCF does not have any programs
that target subprime borrowers, in the normal course of
lending to customers, loans at lower LTV ratios have been
originated to borrowers with FICO scores below 620. At
December 31, 2011, 26% of the consumer real estate loan
balance had been originated since January 1, 2009, with net
charge-offs of .20%. TCF’s consumer real estate portfolio is
subject to the risk of falling home values and to the general
economic environment, particularly unemployment.
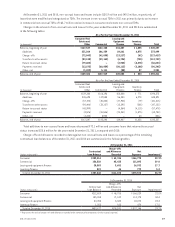
At December 31, 2011, total consumer real estate lines
of credit outstanding were $2.1 billion, down from $2.2
billion at December 31, 2010. Outstanding balances on
consumer real estate lines of credit were 61% of total lines
of credit at both December 31, 2011 and 2010.
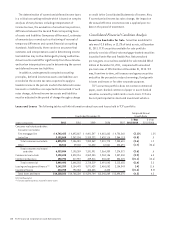
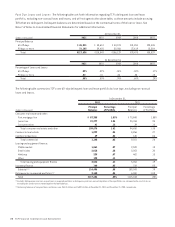
Commercial Banking Commercial real estate
loans decreased $129.5 million in 2011 to $3.2 billion
at December 31, 2011. Variable- and adjustable-rate
loans represented 42% of commercial real estate loans
outstanding at December 31, 2011. Commercial business
loans decreased $67.2 million in 2011 to $250.8 million
at December 31, 2011. Decreases in commercial loan
balances were primarily due to higher levels of payments
in excess of new origination volume. With a focus on
secured lending, approximately 99% of TCF’s commercial
real estate and commercial business loans were secured
either by properties or other business assets at December
31, 2011. At December 31, 2011, approximately 93% of
TCF’s commercial real estate loan portfolio was secured by
properties located in its primary banking markets.
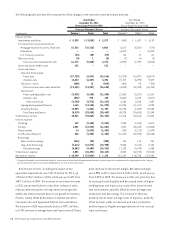
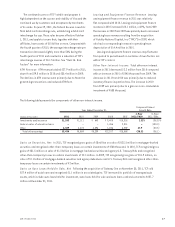
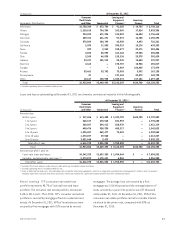
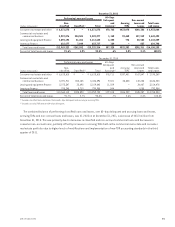
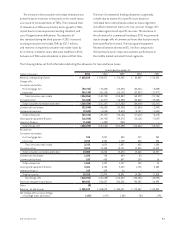
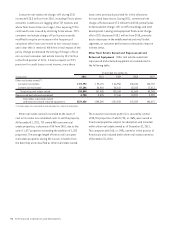
The following table summarizes TCF’s commercial real estate loan portfolio by property and loan type.
At December 31,
2011 2010
(Dollars in thousands)
Number
of Loans Permanent
Construction
and
Development Total
Number
of Loans Permanent
Construction
and
Development Total
Apartments 797 $ 861,504 $ 54,379 $ 915,883 716 $ 754,915 $ 20,338 $ 775,253
Retail services (1) 441 793,515 5,529 799,044 463 865,784 11,767 877,551
Office buildings 232 508,330 23,886 532,216 256 564,631 32,851 597,482
Warehouse/industrial buildings 238 395,188 12,946 408,134 262 459,904 10,475 470,379
Hotels and motels 39 205,697 6 205,703 41 203,794 28,387 232,181
Health care facilities 24 126,136 19,221 145,357 35 111,543 24,961 136,504
Residential home builders 41 31,540 17,890 49,430 31 32,071 19,810 51,881
Other 97 117,578 25,353 142,931 119 133,195 53,790 186,985
Total 1,909 $3,039,488 $159,210 $3,198,698 1,923 $3,125,837 $202,379 $3,328,216
(1) Primarily retail shopping centers and stores, convenience stores, gas stations, restaurants and auto dealerships.
32 TCF Financial Corporation and Subsidiaries