TCF Bank 2011 Annual Report Download - page 39
Download and view the complete annual report
Please find page 39 of the 2011 TCF Bank annual report below. You can navigate through the pages in the report by either clicking on the pages listed below, or by using the keyword search tool below to find specific information within the annual report.-
 1
1 -
2
-
3
-
4
-
5
-
6
-
7
-
8
-
9
-
10
-
11
-
12
-
13
-
14
-
15
-
16
-
17
-
18
-
19
-
20
-
21
-
22
-
23
-
24
-
25
-
26
-
27
-
28
-
 29
29 -
 30
30 -
 31
31 -
 32
32 -
 33
33 -
 34
34 -
 35
35 -
 36
36 -
 37
37 -
 38
38 -
 39
39 -
 40
40 -
 41
41 -
 42
42 -
 43
43 -
 44
44 -
 45
45 -
 46
46 -
 47
47 -
 48
48 -
 49
49 -
50
-
51
-
52
-
53
-
54
-
55
-
56
-
57
-
58
-
59
-
60
-
61
-
62
-
63
-
64
-
65
-
66
-
67
-
68
-
69
-
70
-
71
-
72
-
73
-
74
-
75
-
76
-
77
-
78
-
79
-
80
-
81
-
82
-
83
-
84
-
85
-
86
-
87
-
88
-
89
-
90
-
91
-
92
-
93
-
94
-
95
-
96
-
97
-
98
-
99
-
100
-
101
-
102
-
103
-
104
-
105
-
106
-
107
-
108
-
109
-
110
-
111
-
112
-
113
-
114
-
115
-
116
-
117
-
118
-
119
-
120
-
121
-
122
-
123
-
124
-
125
-
126
-
127
-
128
-
129
-
130
-
131
-
132
-
133
-
134
-
135
-
136
-
137
-
138
-
139
-
140
 |
 |
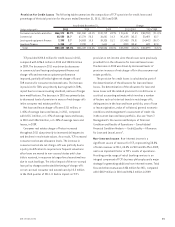
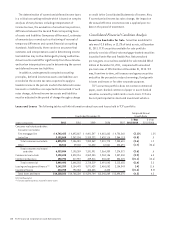
Operating Segment Results RETAIL BANKING — Retail
Banking, consisting of branch banking and retail lending,
reported net income of $49.6 million for 2011, down from
$93 million in 2010 primarily due to decreased fee income in
branch banking. Retail Banking net interest income for 2011
was $448.1 million, up 1.2% from $443 million for 2010.
The Retail Banking provision for credit losses totaled
$162.2 million in 2011, up 15.3% from $140.6 million
in 2010. This increase was primarily due to higher net
charge-offs and troubled debt restructuring (“TDR”)
reserves for consumer real estate loans. Refer to “Item
7. Management’s Discussion and Analysis of Financial
Condition and Results of Operations — Consolidated Income
Statement Analysis — Provision for Credit Losses” for
further discussion.
Retail Banking non-interest income totaled $337.7
million in 2011, compared with $409.6 million in 2010. Fees
and service charges were $213 million for 2011, down 20.4%
from $267.5 million in 2010. Card revenues were $96.1
million for 2011, down 13.4% from $111 million in 2010.
The decrease in card revenues was primarily attributable
to debit card interchange regulation which took effect on
October 1, 2011. See “Item 7. Management’s Discussion and
Analysis of Financial Condition and Results of Operations
— Consolidated Income Statement Analysis — Non-Interest
Income” for further discussion.
Retail Banking non-interest expense totaled $545.3
million in 2011, down 3.1% from $562.8 million in 2010. The
decrease was primarily due to decreases in compensation
and employee benefit expenses and occupancy expenses as
a result of certain branch closures during 2011.
WHOLESALE BANKING — Wholesale Banking, consisting
of commercial banking, leasing and equipment finance,
inventory finance and auto finance, reported net income of
$76.5 million for 2011, up 93.4% from $39.5 million in 2010.
Net interest income for 2011 was $274.7 million, up 8.5%
from $253.1 million in 2010, as a result of increased income
from inventory finance loans primarily due to average
balance growth of $179 million, partially offset by decreases
in leasing and equipment finance and commercial real
estate portfolio balances and average yields.
The provision for credit losses for Wholesale Banking
totaled $36.1 million in 2011, down from $94 million in
2010. The decrease in the provision for credit losses from
2010 was primarily due to decreased net charge-offs and
decreased non-accrual loans in commercial lending and
leasing and equipment finance.
Wholesale Banking non-interest income totaled $98.7
million in 2011, essentially flat from 2010. Decreases in
operating lease revenues and floorplan inventory inspection
fees were offset by increases resulting from gains on
sales-type lease activity, gains on sales of auto loans and
increases in commercial loan prepayment fees.
Wholesale Banking non-interest expense totaled $208.7
million in 2011, up $17.4 million from $191.3 million in
2010, primarily as a result of increased FDIC insurance
premiums resulting from changes in the FDIC insurance
rate calculations for banks over $10 billion in total assets,
increased valuation write-downs of commercial real
estate properties owned, and the ramp-up of expenses
related to the exclusive financing program for Bombardier
Recreational Products (“BRP”) that will begin funding
early in 2012, partially offset by decreased operating lease
depreciation due to the reduction in the operating lease
portion of the portfolio.
TREASURY SERVICES — Treasury Services reported a
net loss of $17 million in 2011, down from net income
of $16.2 million in 2010. The $33.2 million change was
primarily due to gains on sales of securities of $31.5 million
in 2010 compared with gains of $8 million in 2011, along
with the impact of increased asset liquidity and increased
asset sensitivity, partially offset by a lower average cost
of borrowing.
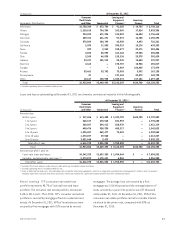
Consolidated Income Statement Analysis
Net Interest Income Net interest income, the difference
between interest earned on loans and leases, investments
and other interest-earning assets (interest income), and
interest paid on deposits and borrowings (interest expense),
represented 61.2% of TCF’s total revenue in 2011, 56.5%
in 2010 and 54.6% in 2009. Net interest income divided by
average interest-earning assets is referred to as the net
interest margin, expressed as a percentage. Net interest
income and net interest margin are affected by changes
in prevailing short- and long-term interest rates, loan and
deposit pricing strategies and competitive conditions, the
volume and the mix of interest-earning assets and interest-
bearing liabilities, the level of non-performing assets, and
the impact of modified loans and leases.
212011 Form 10-K