TCF Bank 2011 Annual Report Download - page 44
Download and view the complete annual report
Please find page 44 of the 2011 TCF Bank annual report below. You can navigate through the pages in the report by either clicking on the pages listed below, or by using the keyword search tool below to find specific information within the annual report.-
 1
1 -
2
-
3
-
4
-
5
-
6
-
7
-
8
-
9
-
10
-
11
-
12
-
13
-
14
-
15
-
16
-
17
-
18
-
19
-
20
-
21
-
22
-
23
-
24
-
25
-
26
-
27
-
28
-
29
-
30
-
31
-
32
-
33
-
 34
34 -
 35
35 -
 36
36 -
 37
37 -
 38
38 -
 39
39 -
 40
40 -
 41
41 -
 42
42 -
 43
43 -
 44
44 -
 45
45 -
 46
46 -
 47
47 -
 48
48 -
 49
49 -
 50
50 -
 51
51 -
 52
52 -
 53
53 -
 54
54 -
55
-
56
-
57
-
58
-
59
-
60
-
61
-
62
-
63
-
64
-
65
-
66
-
67
-
68
-
69
-
70
-
71
-
72
-
73
-
74
-
75
-
76
-
77
-
78
-
79
-
80
-
81
-
82
-
83
-
84
-
85
-
86
-
87
-
88
-
89
-
90
-
91
-
92
-
93
-
94
-
95
-
96
-
97
-
98
-
99
-
100
-
101
-
102
-
103
-
104
-
105
-
106
-
107
-
108
-
109
-
110
-
111
-
112
-
113
-
114
-
115
-
116
-
117
-
118
-
119
-
120
-
121
-
122
-
123
-
124
-
125
-
126
-
127
-
128
-
129
-
130
-
131
-
132
-
133
-
134
-
135
-
136
-
137
-
138
-
139
-
140
 |
 |

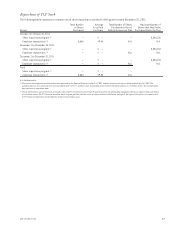
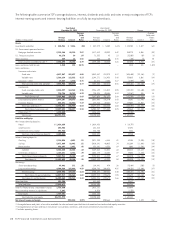
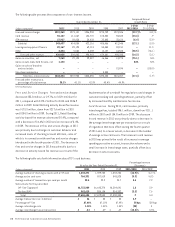
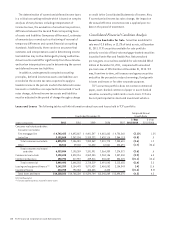
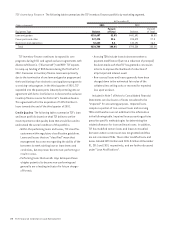
The following table presents the components of non-interest income.
Year Ended December 31,
Compound Annual
Growth Rate
(Dollars in thousands) 2011 2010 2009 2008 2007
1-Year
2011/2010
5-Year
2011/2006
Fees and service charges $219,363 $273,181 $286,908 $270,739 $278,046 (19.7)% (4.1)%
Card revenue 96,147 111,067 104,770 103,082 98,880 (13.4) .9
ATM revenue 27,927 29,836 30,438 32,645 35,620 (6.4) (5.9)
Subtotal 343,437 414,084 422,116 406,466 412,546 (17.1) (3.0)
Leasing and equipment finance 89,167 89,194 69,113 55,488 59,151 – 11.0
Other 3,434 5,584 5,239 12,107 18,588 (38.5) (36.1)
Fees and other revenue 436,038 508,862 496,468 474,061 490,285 (14.3) (2.1)
Gains on securities, net 7,263 29,123 29,387 16,066 13,278 (75.1) N.M.
Gains on auto loans held for sale, net 1,133 – – – – N.M. N.M.
Gains on sales of branches
and real estate – – – – 37,894 – (100.0)
Visa share redemption – – – 8,308 – – –
Total non-interest income $444,434 $537,985 $525,855 $498,435 $541,457 (17.4) (1.9)
Fees and other revenue as a
percentage of total revenue 38.1% 41.1% 42.8% 43.4% 44.9%
N.M. Not Meaningful.
Fees and Service Charges Fees and service charges
decreased $53.8 million, or 19.7%, to $219.4 million for
2011, compared with $273.2 million for 2010 and $286.9
million in 2009. Retail Banking activity based fee revenue
was $173.3 million, down from $217.6 million in 2010
and $254.3 million in 2009. During 2011, Retail Banking
activity-based fee revenues decreased 20.4%, compared
with a decrease of 14.4% in 2010 and an increase of 8.4%
in 2009. The decrease in fees and service charges in 2011
was primarily due to changes in customer behavior and
increased levels of checking account attrition, some of
which is in connection with new fees and service charges
introduced in the fourth quarter of 2011. The decrease in
fees and service charges in 2010 was primarily due to a
decrease in activity-based fee revenue as a result of the
implementation of overdraft fee regulations and changes in
customer banking and spending behavior, partially offset
by increased monthly maintenance fee income.
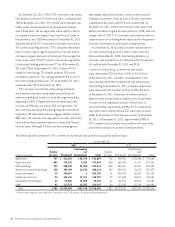
Card Revenue During 2011, card revenue, primarily
interchange fees, totaled $96.1 million, down from $111.1
million in 2010 and $104.8 million in 2009. The decrease
in card revenue in 2011 was primarily due to a decrease in
the average interchange rate per transaction as a result
of regulation that took effect during the fourth quarter
of 2011 and, to a lesser extent, a decrease in the number
of average active card users. The increase in card revenue
in 2010 was primarily the result of increases in average
spending per active account, transaction volume and a
small increase in interchange rates, partially offset by a
decrease in active accounts.
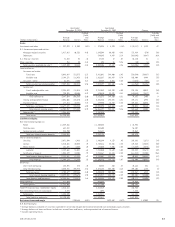
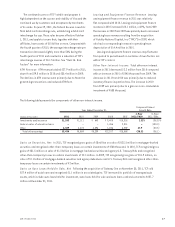
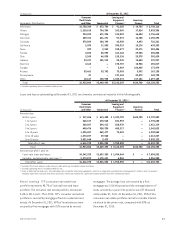
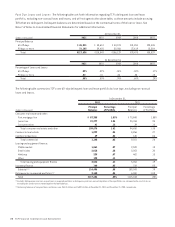
The following table sets forth information about TCF’s card business.
At or For the Year Ended December 31,
Percentage Increase
(Decrease)
(Dollars in thousands) 2011 2010 2009 2011/2010 2010/2009
Average number of checking accounts with a TCF card 1,233,271 1,399,730 1,533,234 (11.9)% (8.7)%
Average active card users 764,331 807,519 843,825 (5.3) (4.3)
Average number of transactions per card per month 23.4 22.2 20.7 5.4 7.2
Sales volume for the year ended:
Off-line (Signature) $6,723,989 $6,645,374 $6,394,041 1.2 3.9
On-line (PIN) 962,615 984,134 914,302 (2.2) 7.6
Total $7,686,604 $7,629,508 $7,308,343 .7 4.4
Average transaction size (in dollars) $ 36 $ 35 $ 35 2.9 –
Percentage off-line 87.48% 87.10% 87.49% 38 bps (39)bps
Average interchange rate 1.18% 1.38% 1.34% (20) 4
Average interchange fee per transaction $ .42 $ .49 $ .47 (14.3)% 4.3%
26 TCF Financial Corporation and Subsidiaries