TCF Bank 2011 Annual Report Download - page 47
Download and view the complete annual report
Please find page 47 of the 2011 TCF Bank annual report below. You can navigate through the pages in the report by either clicking on the pages listed below, or by using the keyword search tool below to find specific information within the annual report.-
 1
1 -
2
-
3
-
4
-
5
-
6
-
7
-
8
-
9
-
10
-
11
-
12
-
13
-
14
-
15
-
16
-
17
-
18
-
19
-
20
-
21
-
22
-
23
-
24
-
25
-
26
-
27
-
28
-
29
-
30
-
31
-
32
-
33
-
34
-
35
-
36
-
 37
37 -
 38
38 -
 39
39 -
 40
40 -
 41
41 -
 42
42 -
 43
43 -
 44
44 -
 45
45 -
 46
46 -
 47
47 -
 48
48 -
 49
49 -
 50
50 -
 51
51 -
 52
52 -
 53
53 -
 54
54 -
 55
55 -
 56
56 -
 57
57 -
58
-
59
-
60
-
61
-
62
-
63
-
64
-
65
-
66
-
67
-
68
-
69
-
70
-
71
-
72
-
73
-
74
-
75
-
76
-
77
-
78
-
79
-
80
-
81
-
82
-
83
-
84
-
85
-
86
-
87
-
88
-
89
-
90
-
91
-
92
-
93
-
94
-
95
-
96
-
97
-
98
-
99
-
100
-
101
-
102
-
103
-
104
-
105
-
106
-
107
-
108
-
109
-
110
-
111
-
112
-
113
-
114
-
115
-
116
-
117
-
118
-
119
-
120
-
121
-
122
-
123
-
124
-
125
-
126
-
127
-
128
-
129
-
130
-
131
-
132
-
133
-
134
-
135
-
136
-
137
-
138
-
139
-
140
 |
 |
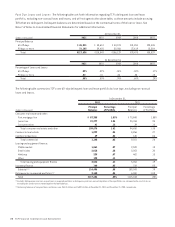
increase in 2011 was primarily due to changes in the account
premium programs beginning in April 2011, which increased
the premiums paid for each qualified account opening. The
decrease in 2010 was primarily due to revised marketing
strategies and lower checking account production. New
checking accounts increased 3.1% in 2011 compared with
2010 and decreased 37% in 2010 compared with 2009.
Advertising and Marketing Advertising and marketing
expenses totaled $10 million in 2011, compared to $13.1
million in 2010 and $17.1 million in 2009. The decrease
in 2011 was primarily due to the discontinuation of the
debit card rewards program in the third quarter of 2011 in
response to new federal regulation regarding debit card
interchange fees. The decrease in 2010 was primarily the
result of retail banking product strategies and a related
decrease in spending on media advertisements.
Other Non-Interest Expense Other non-interest
expense totaled $146.9 million in 2011, relatively flat
compared with 2010. Other non-interest expense totaled
$147.9 million in 2010, up $4.2 million from 2009, primarily
attributable to increased consulting costs related to the
administration of the Company’s Bank Secrecy Act program
and other legal costs related to the challenge of the Durbin
Amendment of the Dodd-Frank Act.
Foreclosed Real Estate and Repossessed Assets, Net
Foreclosed real estate and repossessed assets expense,
net totaled $49.2 million in 2011, compared to $40.4
million in 2010 and $31.9 million in 2009. The increase
in 2011 was primarily due to increased valuation write-
downs on commercial real estate properties. The increase
in 2010 was primarily due to an increase in the average
number of consumer real estate properties owned and the
associated expenses, continued valuation write-downs of
both consumer and commercial real estate properties, and
increased property tax expenses.
Operating Lease Depreciation Operating lease
depreciation totaled $30 million in 2011, down $7.1 million
from $37.1 million in 2010, which was up $14.7 million from
$22.4 million in 2009. The decrease in 2011 was primarily
due to the reduction in the operating lease portion of the
portfolio. The increase in 2010 was primarily due to the
acquisition of FNCI in 2009.
Other Credits Costs, Net Other credit costs, net is
comprised of consumer real estate loan pool insurance,
write-downs on carrying values of operating leases due to
customer defaults and reserve requirements for expected
losses on unfunded commitments. Other credit costs, net
totaled $2.8 million for 2011, down from $6 million in 2010,
which was down from $12.1 million in 2009. The decrease
in 2011 was primarily due to reduced premium related
expense on consumer real estate loan pool insurance. The
decrease in 2010 was primarily attributable to the reversal
of reserves on several unfunded commitments that were
closed and lower premium costs related to consumer real
estate loan pool insurance.
Visa Indemnification Expense TCF is a member of Visa
U.S.A. for issuance and processing of its card transactions.
As a member of Visa, TCF has an obligation to indemnify
Visa U.S.A. under its bylaws and Visa under a retrospective
responsibility plan, for contingent losses in connection
with certain covered litigation disclosed in Visa’s public
filings with the SEC based on its membership proportion. TCF
is not a party to the lawsuits brought against Visa U.S.A.
TCF’s membership proportion in Visa U.S.A. is .16234% at
December 31, 2011.
As of December 31, 2011, TCF held 308,219 Visa Inc.
Class B shares with no recorded value that are generally
restricted from sale, other than to other Class B share-
holders, and are subject to dilution as a result of TCF’s
indemnification obligation.
At December 31, 2011, TCF had no remaining Visa
contingent indemnification obligation. TCF’s indemnification
obligation for Visa’s covered litigation is a highly judgmental
estimate. TCF must rely on Visa’s public disclosures about
the covered litigation in making estimates of the Visa
contingent indemnification obligation.
Income Taxes Income tax expense represented 36.04% of
income before income tax expense during 2011, compared
with 36.89% and 34.67% in 2010 and 2009, respectively.
The lower effective income tax rate for 2011 as compared
to 2010 is primarily due to changes in state income tax
expense related to tax return filings. The lower effective
income tax rate for 2009 as compared to 2010 is primarily
due to significant favorable developments in uncertain tax
positions in 2009.
292011 Form 10-K