TCF Bank 2011 Annual Report Download - page 65
Download and view the complete annual report
Please find page 65 of the 2011 TCF Bank annual report below. You can navigate through the pages in the report by either clicking on the pages listed below, or by using the keyword search tool below to find specific information within the annual report.-
 1
1 -
2
-
3
-
4
-
5
-
6
-
7
-
8
-
9
-
10
-
11
-
12
-
13
-
14
-
15
-
16
-
17
-
18
-
19
-
20
-
21
-
22
-
23
-
24
-
25
-
26
-
27
-
28
-
29
-
30
-
31
-
32
-
33
-
34
-
35
-
36
-
37
-
38
-
39
-
40
-
41
-
42
-
43
-
44
-
45
-
46
-
47
-
48
-
49
-
50
-
51
-
52
-
53
-
54
-
 55
55 -
 56
56 -
 57
57 -
 58
58 -
 59
59 -
 60
60 -
 61
61 -
 62
62 -
 63
63 -
 64
64 -
 65
65 -
 66
66 -
 67
67 -
 68
68 -
 69
69 -
 70
70 -
 71
71 -
 72
72 -
 73
73 -
 74
74 -
 75
75 -
76
-
77
-
78
-
79
-
80
-
81
-
82
-
83
-
84
-
85
-
86
-
87
-
88
-
89
-
90
-
91
-
92
-
93
-
94
-
95
-
96
-
97
-
98
-
99
-
100
-
101
-
102
-
103
-
104
-
105
-
106
-
107
-
108
-
109
-
110
-
111
-
112
-
113
-
114
-
115
-
116
-
117
-
118
-
119
-
120
-
121
-
122
-
123
-
124
-
125
-
126
-
127
-
128
-
129
-
130
-
131
-
132
-
133
-
134
-
135
-
136
-
137
-
138
-
139
-
140
 |
 |

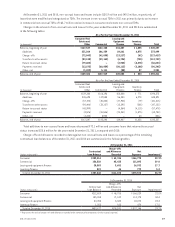
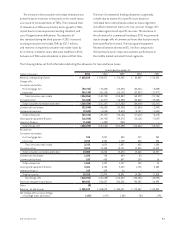
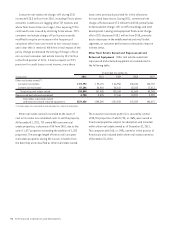
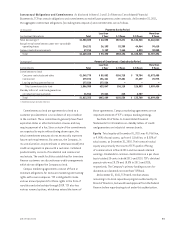
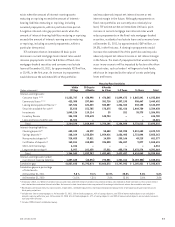
In contrast to GAAP-basis measures, the total tier 1 common risk-based capital ratio excludes the effect of qualifying
trust preferred securities, qualifying non-controlling interest in subsidiaries and cumulative perpetual preferred stock.
Management reviews the total tier 1 common risk-based capital ratio as an ongoing measure and has included this
information because of current interest by investors, rating agencies and banking regulators. The methodology for
calculating total tier 1 common risk-based capital may vary between companies. The following table is a reconciliation
of GAAP to non-GAAP measures.
At December 31,
(Dollars in thousands) 2011 2010
Total tier 1 risk-based capital ratio:
Total tier 1 capital $ 1,706,926 $ 1,459,703
Total risk-weighted assets 13,475,330 13,936,629
Total tier 1 risk-based capital ratio 12.67% 10.47%
Computation of tier 1 common capital ratio:
Total tier 1 capital $ 1,706,926 $ 1,459,703
Less:
Qualifying trust preferred securities 115,000 115,000
Qualifying non-controlling interest in subsidiaries 10,494 8,500
Total tier 1 common capital $ 1,581,432 $ 1,336,203
Total risk-weighted assets $13,475,330 $13,936,629
Total tier 1 common capital ratio 11.74% 9.59%
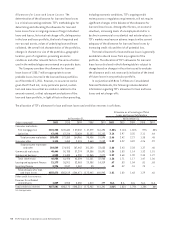
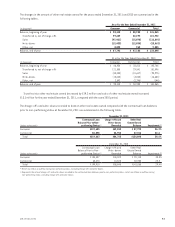
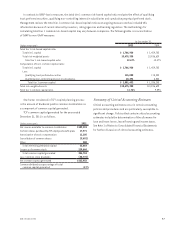
One factor considered in TCF’s capital planning process
is the amount of dividends paid to common stockholders as
a component of common capital generated.
TCF’s common capital generated for the year ended
December 31, 2011 is as follows.
(Dollars in thousands) 2011
Net income available to common stockholders $109,394
Common shares purchased by TCF employee benefit plans 17,971
Amortization of stock compensation 11,105
Cancellation of common shares (3,692)
Other 280
Total internally generated capital 25,664
Issuance of common stock 219,666
Total common capital generated 354,724
Less: Common stock dividends (30,772)
Net common capital generated $323,952
Common dividend as a percentage of total
common capital generated 8.7%
Summary of Critical Accounting Estimates
Critical accounting estimates occur in certain accounting
policies and procedures and are particularly susceptible to
significant change. Policies that contain critical accounting
estimates include the determination of the allowance for
loan and lease losses, lease financing and income taxes.
See Note 1 of Notes to Consolidated Financial Statements
for further discussion of critical accounting estimates.
472011 Form 10-K