TCF Bank 2011 Annual Report Download - page 89
Download and view the complete annual report
Please find page 89 of the 2011 TCF Bank annual report below. You can navigate through the pages in the report by either clicking on the pages listed below, or by using the keyword search tool below to find specific information within the annual report.-
 1
1 -
2
-
3
-
4
-
5
-
6
-
7
-
8
-
9
-
10
-
11
-
12
-
13
-
14
-
15
-
16
-
17
-
18
-
19
-
20
-
21
-
22
-
23
-
24
-
25
-
26
-
27
-
28
-
29
-
30
-
31
-
32
-
33
-
34
-
35
-
36
-
37
-
38
-
39
-
40
-
41
-
42
-
43
-
44
-
45
-
46
-
47
-
48
-
49
-
50
-
51
-
52
-
53
-
54
-
55
-
56
-
57
-
58
-
59
-
60
-
61
-
62
-
63
-
64
-
65
-
66
-
67
-
68
-
69
-
70
-
71
-
72
-
73
-
74
-
75
-
76
-
77
-
78
-
 79
79 -
 80
80 -
 81
81 -
 82
82 -
 83
83 -
 84
84 -
 85
85 -
 86
86 -
 87
87 -
 88
88 -
 89
89 -
 90
90 -
 91
91 -
 92
92 -
 93
93 -
 94
94 -
 95
95 -
 96
96 -
 97
97 -
 98
98 -
 99
99 -
100
-
101
-
102
-
103
-
104
-
105
-
106
-
107
-
108
-
109
-
110
-
111
-
112
-
113
-
114
-
115
-
116
-
117
-
118
-
119
-
120
-
121
-
122
-
123
-
124
-
125
-
126
-
127
-
128
-
129
-
130
-
131
-
132
-
133
-
134
-
135
-
136
-
137
-
138
-
139
-
140
 |
 |

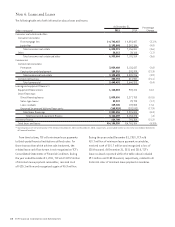
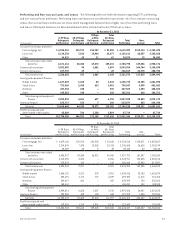
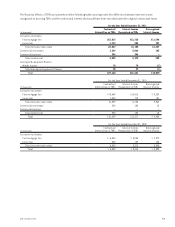
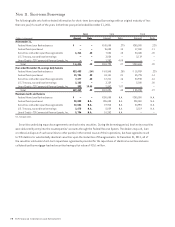
Performing and Non-accrual Loans and Leases The following tables set forth information regarding TCF’s performing
and non-accrual loans and leases. Performing loans and leases are considered to have a lower risk of loss and are on accruing
status. Non-accrual loans and leases are those which management believes have a higher risk of loss than performing loans
and leases. Delinquent balances are determined based on the contractual terms of the loan or lease.
At December 31, 2011
(In thousands)
0-59 Days
Delinquent
and Accruing
60-89 Days
Delinquent
and Accruing
90 Days
or More
Delinquent
and Accruing
Total
60+ Days
Delinquent
and Accruing Total
Performing Non-
accrual Total
Consumer real estate and other:
First mortgage lien $ 4,525,951 $32,571 $54,787 $ 87,358 $ 4,613,309 $129,114 $ 4,742,423
Junior lien 2,110,334 7,813 14,464 22,277 2,132,611 20,257 2,152,868
Other 34,829 20 21 41 34,870 15 34,885
Total consumer real estate
and other 6,671,114 40,404 69,272 109,676 6,780,790 149,386 6,930,176
Commercial real estate 3,092,855 98 1,001 1,099 3,093,954 104,744 3,198,698
Commercial business 227,970 49 – 49 228,019 22,775 250,794
Total commercial 3,320,825 147 1,001 1,148 3,321,973 127,519 3,449,492
Leasing and equipment finance:
Middle market 1,627,369 1,260 84 1,344 1,628,713 13,185 1,641,898
Small ticket 792,566 2,368 613 2,981 795,547 5,535 801,082
Winthrop 447,334 235 – 235 447,569 1,253 448,822
Other 185,563 198 – 198 185,761 610 186,371
Total leasing and equipment
finance 3,052,832 4,061 697 4,758 3,057,590 20,583 3,078,173
Inventory finance 623,717 153 7 160 623,877 823 624,700
Subtotal 13,668,488 44,765 70,977 115,742 13,784,230 298,311 14,082,541
Portfolios acquired with
deteriorated credit quality 65,820 766 1,128 1,894 67,714 – 67,714
Total $13,734,308 $45,531 $72,105 $117,636 $13,851,944 $298,311 $14,150,255
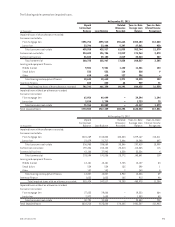
At December 31, 2010
(In thousands)
0-59 Days
Delinquent
and Accruing
60-89 Days
Delinquent
and Accruing
90 Days
or More
Delinquent
and Accruing
Total
60+ Days
Delinquent
and Accruing Total
Performing Non-
accrual Total
Consumer real estate and other:
First mortgage lien $ 4,679,168 $30,910 $42,938 $ 73,848 $ 4,753,016 $140,871 $ 4,893,887
Junior lien 2,214,805 7,398 13,365 20,763 2,235,568 26,626 2,262,194
Other 39,099 30 9 39 39,138 50 39,188
Total consumer real estate
and other 6,933,072 38,338 56,312 94,650 7,027,722 167,547 7,195,269
Commercial real estate 3,215,055 8,856 – 8,856 3,223,911 104,305 3,328,216
Commercial business 279,879 165 – 165 280,044 37,943 317,987
Total commercial 3,494,934 9,021 – 9,021 3,503,955 142,248 3,646,203
Leasing and equipment finance:
Middle market 1,606,125 3,221 330 3,551 1,609,676 23,153 1,632,829
Small ticket 695,491 3,172 727 3,899 699,390 11,018 710,408
Winthrop 529,467 462 – 462 529,929 134 530,063
Other 158,431 – – – 158,431 102 158,533
Total leasing and equipment
finance 2,989,514 6,855 1,057 7,912 2,997,426 34,407 3,031,833
Inventory finance 790,955 189 155 344 791,299 1,055 792,354
Subtotal 14,208,475 54,403 57,524 111,927 14,320,402 345,257 14,665,659
Portfolios acquired with
deteriorated credit quality 119,529 1,215 1,901 3,116 122,645 – 122,645
Total $14,328,004 $55,618 $59,425 $115,043 $14,443,047 $345,257 $14,788,304
712011 Form 10-K