TCF Bank 2011 Annual Report Download - page 53
Download and view the complete annual report
Please find page 53 of the 2011 TCF Bank annual report below. You can navigate through the pages in the report by either clicking on the pages listed below, or by using the keyword search tool below to find specific information within the annual report.-
 1
1 -
2
-
3
-
4
-
5
-
6
-
7
-
8
-
9
-
10
-
11
-
12
-
13
-
14
-
15
-
16
-
17
-
18
-
19
-
20
-
21
-
22
-
23
-
24
-
25
-
26
-
27
-
28
-
29
-
30
-
31
-
32
-
33
-
34
-
35
-
36
-
37
-
38
-
39
-
40
-
41
-
42
-
 43
43 -
 44
44 -
 45
45 -
 46
46 -
 47
47 -
 48
48 -
 49
49 -
 50
50 -
 51
51 -
 52
52 -
 53
53 -
 54
54 -
 55
55 -
 56
56 -
 57
57 -
 58
58 -
 59
59 -
 60
60 -
 61
61 -
 62
62 -
 63
63 -
64
-
65
-
66
-
67
-
68
-
69
-
70
-
71
-
72
-
73
-
74
-
75
-
76
-
77
-
78
-
79
-
80
-
81
-
82
-
83
-
84
-
85
-
86
-
87
-
88
-
89
-
90
-
91
-
92
-
93
-
94
-
95
-
96
-
97
-
98
-
99
-
100
-
101
-
102
-
103
-
104
-
105
-
106
-
107
-
108
-
109
-
110
-
111
-
112
-
113
-
114
-
115
-
116
-
117
-
118
-
119
-
120
-
121
-
122
-
123
-
124
-
125
-
126
-
127
-
128
-
129
-
130
-
131
-
132
-
133
-
134
-
135
-
136
-
137
-
138
-
139
-
140
 |
 |

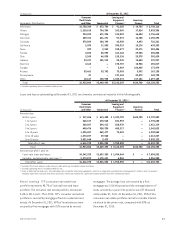
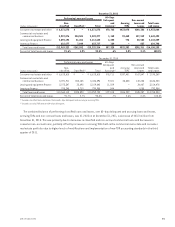
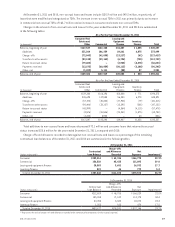
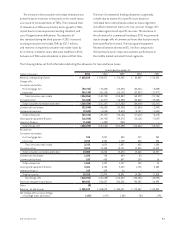
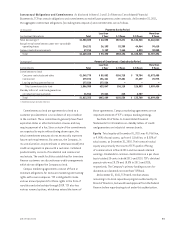
December 31, 2011
Performing Loans and Leases 60+ Days
Delinquent
and
Accruing(2)
Accruing
TDRs
Non-accrual
Loans and
Leases
Total Loans
and Leases(Dollars in thousands)
Non-
classified Classified(1) Total
Consumer real estate and other $ 6,271,575 $ – $ 6,271,575 $79,765 $433,078 $149,386 $ 6,933,804
Commercial real estate and
commercial business 2,987,876 234,501 3,222,377 1,148 98,448 127,519 3,449,492
Leasing and equipment finance 3,093,194 21,451 3,114,645 6,255 776 20,583 3,142,259
Inventory finance 616,677 7,040 623,717 160 – 823 624,700
Total loans and leases $12,969,322 $262,992 $13,232,314 $87,328 $532,302 $298,311 $14,150,255
Percent of total loans and leases 91.6% 1.9% 93.5% .6% 3.8% 2.1% 100.0%
December 31, 2010
Performing Loans and Leases 60+ Days
Delinquent
and
Accruing(2)
Accruing
TDRs
Non-accrual
Loans and
Leases
Total Loans
and Leases(Dollars in thousands)
Non-
classified Classified(1) Total
Consumer real estate and other $ 6,613,610 $ – $ 6,613,610 $ 76,711 $ 337,401 $ 167,547 $ 7,195,269
Commercial real estate and
commercial business 3,091,911 354,185 3,446,096 9,021 48,838 142,248 3,646,203
Leasing and equipment finance 3,073,347 35,695 3,109,042 11,029 – 34,407 3,154,478
Inventory finance 785,245 5,710 790,955 344 – 1,055 792,354
Total loans and leases $ 13,564,113 $ 395,590 $ 13,959,703 $ 97,105 $386,239 $ 345,257 $14,788,304
Percent of total loans and leases 91.7% 2.7% 94.4% .7% 2.6% 2.3% 100.0%
(1) Excludes classified loans and leases that are 60+ days delinquent and accruing or accruing TDRs.
(2) Excludes accruing TDRs that are 60+ days delinquent.
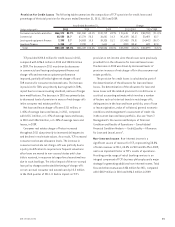
The combined balance of performing classified loans and leases, over 60-day delinquent and accruing loans and leases,
accruing TDRs and non-accrual loans and leases, was $1.2 billion at December 31, 2011, a decrease of $43.3 million from
December 31, 2010. This was primarily due to decreases in classified and non-accrual commercial loans and decreases in
consumer non-accrual loans, partially offset by increases in accruing TDRs both in the commercial real estate and consumer
real estate portfolios due to higher levels of modifications and implementation of new TDR accounting standards in the third
quarter of 2011.
352011 Form 10-K