Spirit Airlines 2013 Annual Report Download - page 83
Download and view the complete annual report
Please find page 83 of the 2013 Spirit Airlines annual report below. You can navigate through the pages in the report by either clicking on the pages listed below, or by using the keyword search tool below to find specific information within the annual report.-
 1
1 -
2
-
3
-
4
-
5
-
6
-
7
-
8
-
9
-
10
-
11
-
12
-
13
-
14
-
15
-
16
-
17
-
18
-
19
-
20
-
21
-
22
-
23
-
24
-
25
-
26
-
27
-
28
-
29
-
30
-
31
-
32
-
33
-
34
-
35
-
36
-
37
-
38
-
39
-
40
-
41
-
42
-
43
-
44
-
45
-
46
-
47
-
48
-
49
-
50
-
51
-
52
-
53
-
54
-
55
-
56
-
57
-
58
-
59
-
60
-
61
-
62
-
63
-
64
-
65
-
66
-
67
-
68
-
69
-
70
-
71
-
72
-
 73
73 -
 74
74 -
 75
75 -
 76
76 -
 77
77 -
 78
78 -
 79
79 -
 80
80 -
 81
81 -
 82
82 -
 83
83 -
 84
84 -
 85
85 -
 86
86 -
 87
87 -
 88
88 -
 89
89 -
 90
90 -
 91
91 -
 92
92 -
 93
93 -
94
-
95
 |
 |

Notes to Financial Statements—(Continued)
83
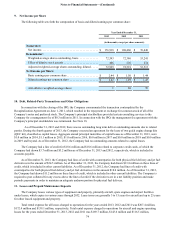
constant, a significant increase (decrease) in implied volatility would result in a significantly higher (lower) determination of
fair value measurement for the Company's aircraft fuel derivatives.
The Company's Valuation Group is made up of individuals from the Company's Risk Management, Treasury and
Corporate Accounting departments. The Valuation Group is responsible for the Company's valuation policies, procedures and
execution thereof. The Company's Valuation Group reports to the Company's Chief Financial Officer and Finance Committee
who approve all derivative transactions. The Valuation Group compares the results of the Company's internally developed
valuation methods with counterparty reports at each balance sheet date and assesses the Company's valuation methods for
accurateness and identifies any needs for modification.
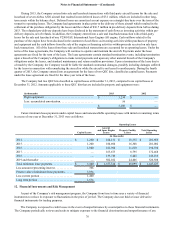
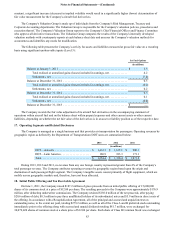
The following table presents the Company’s activity for assets and liabilities measured at gross fair value on a recurring
basis using significant unobservable inputs (Level 3):
Jet Fuel Options
(in millions)
Balance at January 1, 2011 . . . . . . . . . . . . . . . . . . . . . . . . . . . . . . . . . . . . . . . . . . . . . . . . $ 3.5
Total realized or unrealized gains (losses) included in earnings, net . . . . . . . . . . . . . 4.2
Settlements, net. . . . . . . . . . . . . . . . . . . . . . . . . . . . . . . . . . . . . . . . . . . . . . . . . . . . . . (7.4)
Balance at December 31, 2011 . . . . . . . . . . . . . . . . . . . . . . . . . . . . . . . . . . . . . . . . . . . . . 0.3
Total realized or unrealized gains (losses) included in earnings, net . . . . . . . . . . . . . (0.2)
Settlements, net. . . . . . . . . . . . . . . . . . . . . . . . . . . . . . . . . . . . . . . . . . . . . . . . . . . . . . 0.2
Balance at December 31, 2012 . . . . . . . . . . . . . . . . . . . . . . . . . . . . . . . . . . . . . . . . . . . . . 0.3
Total realized or unrealized gains (losses) included in earnings, net . . . . . . . . . . . . . 0.1
Settlements, net. . . . . . . . . . . . . . . . . . . . . . . . . . . . . . . . . . . . . . . . . . . . . . . . . . . . . . (0.4)
Balance at December 31, 2013 . . . . . . . . . . . . . . . . . . . . . . . . . . . . . . . . . . . . . . . . . . . . . $ —
The Company records the fair value adjustment of its aircraft fuel derivatives in the accompanying statement of
operations within aircraft fuel and on the balance sheet within prepaid expenses and other current assets or other current
liabilities, depending on whether the net fair value of the derivatives is in an asset or liability position as of the respective date.
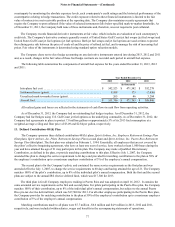
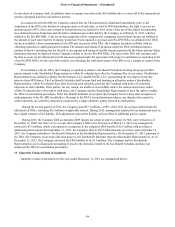
17. Operating Segments and Related Disclosures
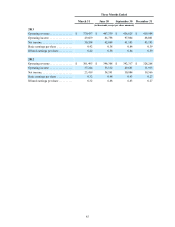
The Company is managed as a single business unit that provides air transportation for passengers. Operating revenues by
geographic region as defined by the Department of Transportation (DOT) area are summarized below:
2013 2012 2011
(in millions)
DOT—domestic . . . . . . . . . . . . . . . . . . . . . . . . . $ 1,467.5 $ 1,135.1 $ 900.1
DOT—Latin America . . . . . . . . . . . . . . . . . . . . . 186.9 183.3 171.1
Total. . . . . . . . . . . . . . . . . . . . . . . . . . . . . . . . . . . $ 1,654.4 $ 1,318.4 $ 1,071.2
During 2013, 2012 and 2011, no revenue from any one foreign country represented greater than 4% of the Company’s
total passenger revenue. The Company attributes operating revenues by geographic region based upon the origin and
destination of each passenger flight segment. The Company’s tangible assets consist primarily of flight equipment, which are
mobile across geographic markets and, therefore, have not been allocated.
18. Initial Public Offering and Tax Receivable Agreement
On June 1, 2011, the Company raised $187.2 million of gross proceeds from an initial public offering of 15,600,000
shares of its common stock at a price of $12.00 per share. The resulting proceeds to the Company were approximately $176.9
million, after deducting underwriter commissions. The Company retained $150.0 million of the net proceeds, after paying
$20.6 million of debt, $0.5 million to pay three unaffiliated holders of its subordinated notes and $5.9 million in direct costs of
the offering. In accordance with a Recapitalization Agreement, all of the principal and accrued and unpaid interest on
outstanding notes, to the extent not paid, totaling $279.2 million, as well as all of the Class A and B preferred stock outstanding
immediately prior to the offering along with accrued and unpaid dividends totaling $81.7 million, were exchanged for
30,079,420 shares of common stock at a share price of $12.00 per share. Each share of Class B Common Stock was exchanged