Spirit Airlines 2013 Annual Report Download - page 51
Download and view the complete annual report
Please find page 51 of the 2013 Spirit Airlines annual report below. You can navigate through the pages in the report by either clicking on the pages listed below, or by using the keyword search tool below to find specific information within the annual report.-
 1
1 -
2
-
3
-
4
-
5
-
6
-
7
-
8
-
9
-
10
-
11
-
12
-
13
-
14
-
15
-
16
-
17
-
18
-
19
-
20
-
21
-
22
-
23
-
24
-
25
-
26
-
27
-
28
-
29
-
30
-
31
-
32
-
33
-
34
-
35
-
36
-
37
-
38
-
39
-
40
-
 41
41 -
 42
42 -
 43
43 -
 44
44 -
 45
45 -
 46
46 -
 47
47 -
 48
48 -
 49
49 -
 50
50 -
 51
51 -
 52
52 -
 53
53 -
 54
54 -
 55
55 -
 56
56 -
 57
57 -
 58
58 -
 59
59 -
 60
60 -
 61
61 -
62
-
63
-
64
-
65
-
66
-
67
-
68
-
69
-
70
-
71
-
72
-
73
-
74
-
75
-
76
-
77
-
78
-
79
-
80
-
81
-
82
-
83
-
84
-
85
-
86
-
87
-
88
-
89
-
90
-
91
-
92
-
93
-
94
-
95
 |
 |
51
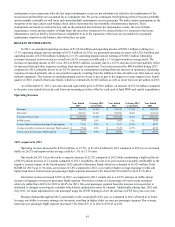
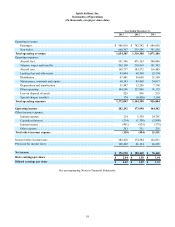
Three Months Ended
March 31,
2012 June 30,
2012 September 30,
2012 December 31,
2012 March 31,
2013 June 30,
2013 September 30,
2013 December 31,
2013
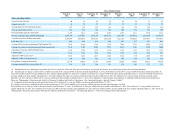
Other operating statistics
Aircraft at end of period . . . . . . . . . . . . . . . . . . . . . . . . . . . . . . . . . . 40 42 42 45 49 50 51 54
Airports served (1). . . . . . . . . . . . . . . . . . . . . . . . . . . . . . . . . . . . . . . 50 52 53 53 52 55 54 53
Average daily Aircraft utilization (hours). . . . . . . . . . . . . . . . . . . . . 12.8 12.9 12.8 12.6 12.6 12.8 12.8 12.5
Average stage length (miles). . . . . . . . . . . . . . . . . . . . . . . . . . . . . . . 912 902 892 932 941 935 956 998
Passenger flight segments (thousands) . . . . . . . . . . . . . . . . . . . . . . . 2,349 2,613 2,814 2,647 2,768 3,111 3,374 3,161
Revenue passenger miles (RPMs) (thousands) . . . . . . . . . . . . . . . . . 2,194,350 2,397,663 2,552,316 2,519,392 2,661,491 2,930,912 3,241,309 3,167,376
Available seat miles (ASMs) (thousands). . . . . . . . . . . . . . . . . . . . . 2,589,014 2,826,916 2,972,651 2,956,150 3,127,214 3,420,257 3,637,951 3,675,972
Load factor (%) . . . . . . . . . . . . . . . . . . . . . . . . . . . . . . . . . . . . . . . . . 84.8 84.8 85.9 85.2 85.1 85.7 89.1 86.2
Average ticket revenue per passenger flight segment ($) . . . . . . . . . 76.65 81.06 71.85 71.30 79.09 77.51 82.84 77.98
Average non-ticket revenue per passenger flight segment ($) . . . . . 51.68 51.47 49.80 52.73 54.75 53.43 52.50 54.88
Operating revenue per ASM (RASM) (cents). . . . . . . . . . . . . . . . . . 11.65 12.25 11.52 11.10 11.85 11.91 12.55 11.43
CASM (cents) . . . . . . . . . . . . . . . . . . . . . . . . . . . . . . . . . . . . . . . . . . 10.21 10.30 9.84 10.02 10.26 9.96 9.86 9.57
Adjusted CASM (cents) (2)(3) . . . . . . . . . . . . . . . . . . . . . . . . . . . . . 10.18 10.26 10.15 10.03 10.14 9.78 10.00 9.67
Adjusted CASM ex fuel (cents) (2). . . . . . . . . . . . . . . . . . . . . . . . . . 5.99 6.05 6.02 5.93 6.04 6.00 5.86 5.78
Fuel gallons consumed (thousands) . . . . . . . . . . . . . . . . . . . . . . . . . 32,730 35,829 37,761 36,670 38,628 42,683 45,521 45,100
Average economic fuel cost per gallon ($) . . . . . . . . . . . . . . . . . . . . 3.31 3.32 3.26 3.31 3.32 3.03 3.31 3.17
(1) Includes airports served during the period that had service canceled as of the end of the period. Previously, we reported only airports served during the period with continuing operations.
(2) Excludes special charges (credits) of $(0.1) million (less than (0.01) cents per ASM) in the three months ended March 31, 2012, $0.0 million (less than 0.01 cents per ASM) in the three months ended June 30,
2012, $(8.3) million ((0.28) cents per ASM) in the three months ended September 30, 2012, $(0.1) million (less than (0.01) cents per ASM) in the three months ended December 31, 2012, $0.0 million (less than 0.01
cents per ASM) in the three months ended March 31, 2013, $0.0 million (less than 0.01 cents per ASM) in the three months ended June 30, 2013, $0.4 million (0.01 cents per ASM) in the three months ended
September 30, 2013 and $(0.3) million ((0.01) cents per ASM) in the three months ended December 31, 2013. These amounts are excluded from all calculations of Adjusted CASM provided in this annual report.
Please see “Management’s Discussion and Analysis of Financial Condition and Results of Operations—Our Operating Expenses—Special Charges (Credits)."
(3) Excludes unrealized mark-to-market (gains) and losses of $0.3 million (0.01 cents per ASM) in the three months ended March 31, 2012,
$1.1 million (0.04 cents per ASM) in the three months ended June 30, 2012, $(0.9) million ((0.03) cents per ASM) in the three months ended September 30, 2012,
$(0.4) million ((0.01) cents per ASM) in the three months ended December 31, 2012, $3.4 million (0.11 cents per ASM) in the three months ended March 31, 2013, $5.8 million (0.17 cents per ASM) in the three
months ended June 30, 2013, $(5.7) million ((0.16) cents per ASM) in the three months ended September 30, 2013 and $(3.2) million ((0.09) cents per ASM) in the three months ended December 31, 2013. Please see
“Management’s Discussion and Analysis of Financial Condition and Results of Operations—Our Operating Expenses—Critical Accounting Policies and Estimates.”