Spirit Airlines 2013 Annual Report Download - page 47
Download and view the complete annual report
Please find page 47 of the 2013 Spirit Airlines annual report below. You can navigate through the pages in the report by either clicking on the pages listed below, or by using the keyword search tool below to find specific information within the annual report.-
 1
1 -
2
-
3
-
4
-
5
-
6
-
7
-
8
-
9
-
10
-
11
-
12
-
13
-
14
-
15
-
16
-
17
-
18
-
19
-
20
-
21
-
22
-
23
-
24
-
25
-
26
-
27
-
28
-
29
-
30
-
31
-
32
-
33
-
34
-
35
-
36
-
 37
37 -
 38
38 -
 39
39 -
 40
40 -
 41
41 -
 42
42 -
 43
43 -
 44
44 -
 45
45 -
 46
46 -
 47
47 -
 48
48 -
 49
49 -
 50
50 -
 51
51 -
 52
52 -
 53
53 -
 54
54 -
 55
55 -
 56
56 -
 57
57 -
58
-
59
-
60
-
61
-
62
-
63
-
64
-
65
-
66
-
67
-
68
-
69
-
70
-
71
-
72
-
73
-
74
-
75
-
76
-
77
-
78
-
79
-
80
-
81
-
82
-
83
-
84
-
85
-
86
-
87
-
88
-
89
-
90
-
91
-
92
-
93
-
94
-
95
 |
 |

47
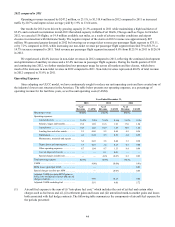
Maintenance, materials and repair costs increased by $10.7 million, or 21.6%, in 2013, as compared to 2012. The
increase in maintenance costs is primarily due to the aging of our fleet, which requires more comprehensive work during
routine scheduled maintenance, as well as the timing of the mix of maintenance checks performed during 2013 as compared to
2012. On October 15, 2013, we had an aircraft experience an engine failure shortly after takeoff. The airframe and engine
incurred damage as a result of the failure. We anticipate we will recover insurance proceeds to cover the expenses related to
this incident and therefore we have expensed the insurance deductible of approximately $0.8 million included in maintenance,
materials and repairs expense. On a per-ASM basis, maintenance, materials and repair costs were generally flat due to the one
time costs associated with the seat maintenance program we incurred in 2012. Maintenance expense and amortization of
deferred heavy maintenance events is expected to increase significantly as our fleet continues to age, resulting in the need for
additional repairs over time.
Depreciation and amortization increased by $16.7 million, or 109.4%, primarily due to deferred heavy aircraft
maintenance events, which in turn resulted in higher amortization expense recorded in 2013 compared to 2012.
Other operating expenses in 2013 increased by $16.7 million, or 13.1%, compared to 2012 primarily due to an increase in
departures of 14.9% which led to increases in variable operating expenses such as ground handling and security expense. On a
per-ASM basis, our other operating expenses decreased as compared to the same period in 2012. The decrease is primarily due
to better operational performance during 2013 as compared to 2012 which helped drive lower passenger re-accommodation
expenses. In addition, we incurred less software consulting costs related to our Enterprise Resource Planning (ERP) system
implementation during 2013 as compared to 2012.
Special charges (credits) for 2012 primarily include a $9.1 million gain related to the sale of four permanent air carrier
slots at Ronald Reagan National Airport (DCA), offset by $0.6 million in secondary offering costs.
2012 compared to 2011
Operating expense increased by $217.6 million for 2012 compared to 2011 mostly due to increases in fuel and labor
costs, which were primarily driven by our 21.3% capacity growth, in addition to increases in other operating costs.
Our adjusted CASM ex fuel for 2012 increased by 4.9% as compared to the same period in 2011. During 2012, we
incurred higher other operating expenses driven by higher costs associated with passenger re-accommodations related to
slightly higher flight cancellations. Additionally, overall increased rates at the airports resulted in increased variable operating
costs such as ground handling expenses and travel and lodging expense. During 2012, we also incurred an increase in
maintenance costs related to our seat maintenance program and an increase in deferred heavy aircraft maintenance events,
which in turn resulted in higher heavy maintenance amortization expense. Our average stage length for 2012 decreased
by 1.3%, contributing to the year-over-year increase in adjusted CASM ex fuel.
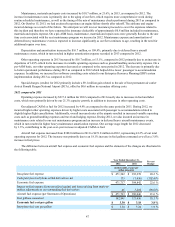
Aircraft fuel expense increased from $388.0 million in 2011 to $471.8 million in 2012, representing 41.2% of our total
operating expenses for 2012. The increase was primarily due to an 18.1% increase in fuel gallons consumed as well as a 3.8%
increase in fuel prices.
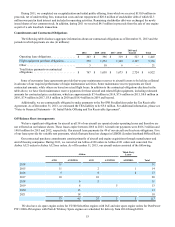
The difference between aircraft fuel expense and economic fuel expense and the elements of the changes are illustrated in
the following table:
Year Ended December 31, Percent
Change
2012 2011
(in thousands, except per
gallon amounts)
Into-plane fuel expense $ 471,542 $ 392,278 20.2 %
Cash paid (received) from settled derivatives, net 175 (7,436) (102.4)%
Economic fuel expense 471,717 384,842 22.6 %
Impact on fuel expense from unrealized (gains) and losses arising from mark-to-
market adjustments to our outstanding fuel derivatives 46 3,204 (98.6)%
Aircraft fuel expense (per Statement of Operations) $ 471,763 $ 388,046 21.6 %
Fuel gallons consumed 142,991 121,030 18.1 %
Economic fuel cost per gallon $ 3.30 $ 3.18 3.8 %
Into-plane fuel cost per gallon $ 3.30 $ 3.24 1.9 %