Spirit Airlines 2013 Annual Report Download - page 43
Download and view the complete annual report
Please find page 43 of the 2013 Spirit Airlines annual report below. You can navigate through the pages in the report by either clicking on the pages listed below, or by using the keyword search tool below to find specific information within the annual report.-
 1
1 -
2
-
3
-
4
-
5
-
6
-
7
-
8
-
9
-
10
-
11
-
12
-
13
-
14
-
15
-
16
-
17
-
18
-
19
-
20
-
21
-
22
-
23
-
24
-
25
-
26
-
27
-
28
-
29
-
30
-
31
-
32
-
 33
33 -
 34
34 -
 35
35 -
 36
36 -
 37
37 -
 38
38 -
 39
39 -
 40
40 -
 41
41 -
 42
42 -
 43
43 -
 44
44 -
 45
45 -
 46
46 -
 47
47 -
 48
48 -
 49
49 -
 50
50 -
 51
51 -
 52
52 -
 53
53 -
54
-
55
-
56
-
57
-
58
-
59
-
60
-
61
-
62
-
63
-
64
-
65
-
66
-
67
-
68
-
69
-
70
-
71
-
72
-
73
-
74
-
75
-
76
-
77
-
78
-
79
-
80
-
81
-
82
-
83
-
84
-
85
-
86
-
87
-
88
-
89
-
90
-
91
-
92
-
93
-
94
-
95
 |
 |

43
maintenance reserve payments after the last major maintenance event are not substantively related to the maintenance of the
leased asset and therefore are accounted for as contingent rent. We accrue contingent rent beginning when it becomes probable
and reasonably estimable we will incur such nonrefundable maintenance reserve payments. We make certain assumptions at the
inception of the lease and at each balance sheet date to determine the recoverability of maintenance deposits. These
assumptions are based on various factors such as the estimated time between the maintenance events, the cost of future
maintenance events and the number of flight hours the aircraft is estimated to be utilized before it is returned to the lessor.
Maintenance reserves held by lessors that are refundable to us at the expiration of the lease are accounted for as prepaid
maintenance deposits on the balance sheet when they are paid.
RESULTS OF OPERATIONS
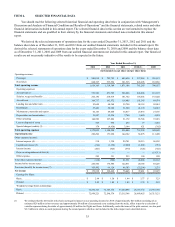
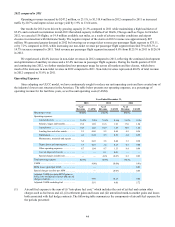
In 2013, we generated operating revenues of $1,654.4 million and operating income of $282.3 million resulting in a
17.1% operating margin and net earnings of $176.9 million. In 2012, we generated operating revenues of $1,318.4 million and
operating income of $174.0 million resulting in a 13.2% operating margin and net earnings of $108.5 million. Operating
revenues increased year-over-year as a result of a 24.2% increase in traffic and a 1.1% improvement in average yield. The
increase in operating income in 2013 over 2012 of $108.3 million, is mainly due to a 25.5% increase in revenue partially offset
by increased fuel and other expenses resulting from increase in operations. Fuel costs increased by $80.0 million during 2013
compared to 2012, primarily driven by an 20.2% increase in consumption resulting from our increase in operations. Operating
expenses increased primarily due to our growth in capacity resulting from the addition of nine aircraft to our fleet and our route
network expansion. The increase in operating margin year-over-year is due in part to the negative revenue impact in the fourth
quarter of 2012 related to Hurricane Sandy, which we estimated to be $25 million, as well as lower fuel cost per gallon in 2013.
As of December 31, 2013, our cash and cash equivalents grew to $530.6 million, an increase of $113.8 million compared
to the prior year, mainly driven by cash from our operating activities offset by cash used to fund PDPs and capital expenditures.
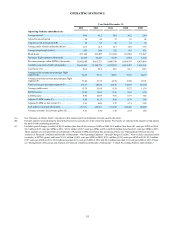
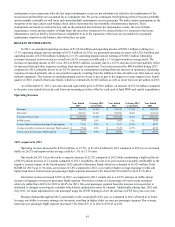
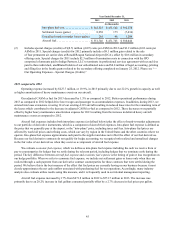
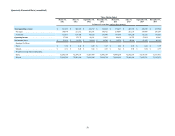
Operating Revenue
Year Ended
2013 % change 2013
versus 2012 Year Ended
2012 % change 2012
versus 2011 Year Ended
2011
Passenger. . . . . . . . . . . . . . . . . . . . . . . . . . . . . . . . . . . . . . $ 986,018 26.0% $ 782,792 13.5% $ 689,650
Non-ticket . . . . . . . . . . . . . . . . . . . . . . . . . . . . . . . . . . . . . 668,367 24.8% 535,596 40.4% 381,536
Total operating revenue. . . . . . . . . . . . . . . . . . . . . . . . . . . $ 1,654,385 25.5% $ 1,318,388 23.1% $ 1,071,186
RASM (cents) . . . . . . . . . . . . . . . . . . . . . . . . . . . . . . . . . . 11.94 2.8% 11.62 1.5% 11.45
Average ticket revenue per passenger flight segment. . . . $ 79.43 5.8% $ 75.11 (7.2)% $ 80.97
Average non-ticket revenue per passenger flight segment $ 53.84 4.8% $ 51.39 14.7% 44.79
Total revenue per passenger flight segment . . . . . . . . . . . $ 133.27 5.4% $ 126.50 0.6% $ 125.76
2013 compared to 2012
Operating revenue increased by $336.0 million, or 25.5%, to $1,654.4 million in 2013 compared to 2012 as we increased
traffic by 24.2% and improved our average yield by 1.1% to 13.79 cents.
Our results for 2013 were driven by a capacity increase of 22.2% compared to 2012 while maintaining a high load factor
of 86.6% and an increase of 1.4 points compared to 2012. In addition, the year-over-year increase was partly attributable to the
negative revenue impact in the fourth quarter 2012 related to Hurricane Sandy which we estimated to be $25 million. Total
RASM for 2013 was 11.94 cents, an increase of 2.8% compared to 2012, as a result of higher average passenger yields and
higher load factor. Total revenue per passenger flight segment increased 5.4% from $126.50 in 2012 to $133.27 in 2013.
Non-ticket revenue increased 24.8% in 2013, as compared to 2012, mainly due to a 24.2% increase in traffic and an
increase in baggage revenue per passenger flight segment. Non-ticket revenue as a percentage of total revenue remained
relatively stable from 40.6% for 2012 to 40.4% for 2013. On a per passenger segment basis the increase is in non-ticket is
attributed to changes to our bag fee schedule which better optimized revenue by channel. Additionally, during June 2012 and
July 2013, we made adjustments to our passenger usage fee (PUF) helping to drive the increase in PUF fees year-over-year.
Stronger demand throughout 2013, particularly in the second half of the year, as compared to 2012, allowed us to better
leverage our ability to revenue manage our inventory, resulting in higher ticket revenue per passenger segment. Our average
ticket fare per passenger flight segment increased 5.8% from $75.11 in 2012 to $79.43 in 2013.