Spirit Airlines 2013 Annual Report Download - page 50
Download and view the complete annual report
Please find page 50 of the 2013 Spirit Airlines annual report below. You can navigate through the pages in the report by either clicking on the pages listed below, or by using the keyword search tool below to find specific information within the annual report.-
 1
1 -
2
-
3
-
4
-
5
-
6
-
7
-
8
-
9
-
10
-
11
-
12
-
13
-
14
-
15
-
16
-
17
-
18
-
19
-
20
-
21
-
22
-
23
-
24
-
25
-
26
-
27
-
28
-
29
-
30
-
31
-
32
-
33
-
34
-
35
-
36
-
37
-
38
-
39
-
 40
40 -
 41
41 -
 42
42 -
 43
43 -
 44
44 -
 45
45 -
 46
46 -
 47
47 -
 48
48 -
 49
49 -
 50
50 -
 51
51 -
 52
52 -
 53
53 -
 54
54 -
 55
55 -
 56
56 -
 57
57 -
 58
58 -
 59
59 -
 60
60 -
61
-
62
-
63
-
64
-
65
-
66
-
67
-
68
-
69
-
70
-
71
-
72
-
73
-
74
-
75
-
76
-
77
-
78
-
79
-
80
-
81
-
82
-
83
-
84
-
85
-
86
-
87
-
88
-
89
-
90
-
91
-
92
-
93
-
94
-
95
 |
 |
50
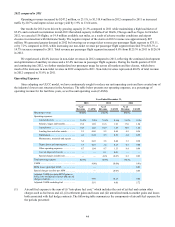
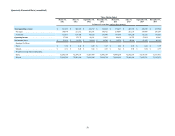
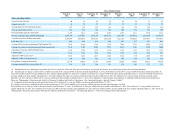
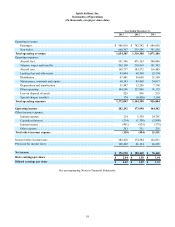
Quarterly Financial Data (unaudited)
Three Months Ended
March 31,
2012 June 30,
2012 September 30,
2012 December 31,
2012 March 31,
2013 June 30,
2013 September 30,
2013 December 31,
2013
(in thousands except share and per share amounts)
Total operating revenue $ 301,495 $ 346,308 $ 342,317 $ 328,268 $ 370,437 $ 407,339 $ 456,625 $ 419,984
Passenger . . . . . . . . . . . . . . . . . . . . . . . . . . . . . . . . . . . . 180,078 211,812 202,181 188,721 218,897 241,119 279,499 246,503
Non-ticket . . . . . . . . . . . . . . . . . . . . . . . . . . . . . . . . . . . 121,417 134,496 140,136 139,547 151,540 166,220 177,126 173,481
Operating income . . . . . . . . . . . . . . . . . . . . . . . . . . . . . . 37,244 55,132 49,681 31,933 49,669 66,758 97,804 68,061
Net income (loss) . . . . . . . . . . . . . . . . . . . . . . . . . . . . . . . $ 23,419 $ 34,591 $ 30,884 $ 19,566 $ 30,554 $ 42,068 61,103 43,193
Earnings Per Share:
Basic. . . . . . . . . . . . . . . . . . . . . . . . . . . . . . . . . . . . . . . . $ 0.32 $ 0.48 $ 0.43 $ 0.27 $ 0.42 $ 0.58 $ 0.84 $ 0.59
Diluted . . . . . . . . . . . . . . . . . . . . . . . . . . . . . . . . . . . . . . $ 0.32 $ 0.48 $ 0.43 $ 0.27 $ 0.42 $ 0.58 $ 0.84 $ 0.59
Weighted average shares outstanding
Basic. . . . . . . . . . . . . . . . . . . . . . . . . . . . . . . . . . . . . . . . 72,292,164 72,379,185 72,427,490 72,442,183 72,486,209 72,592,973 72,631,646 72,657,916
Diluted . . . . . . . . . . . . . . . . . . . . . . . . . . . . . . . . . . . . . . 72,498,705 72,583,690 72,658,298 72,622,718 72,804,245 72,992,084 73,002,761 73,195,479