Spirit Airlines 2013 Annual Report Download - page 48
Download and view the complete annual report
Please find page 48 of the 2013 Spirit Airlines annual report below. You can navigate through the pages in the report by either clicking on the pages listed below, or by using the keyword search tool below to find specific information within the annual report.-
 1
1 -
2
-
3
-
4
-
5
-
6
-
7
-
8
-
9
-
10
-
11
-
12
-
13
-
14
-
15
-
16
-
17
-
18
-
19
-
20
-
21
-
22
-
23
-
24
-
25
-
26
-
27
-
28
-
29
-
30
-
31
-
32
-
33
-
34
-
35
-
36
-
37
-
 38
38 -
 39
39 -
 40
40 -
 41
41 -
 42
42 -
 43
43 -
 44
44 -
 45
45 -
 46
46 -
 47
47 -
 48
48 -
 49
49 -
 50
50 -
 51
51 -
 52
52 -
 53
53 -
 54
54 -
 55
55 -
 56
56 -
 57
57 -
 58
58 -
59
-
60
-
61
-
62
-
63
-
64
-
65
-
66
-
67
-
68
-
69
-
70
-
71
-
72
-
73
-
74
-
75
-
76
-
77
-
78
-
79
-
80
-
81
-
82
-
83
-
84
-
85
-
86
-
87
-
88
-
89
-
90
-
91
-
92
-
93
-
94
-
95
 |
 |

48
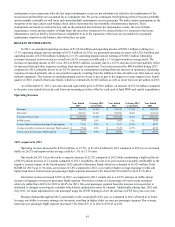
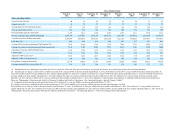
Fuel gallons consumed increased 18.1% as a result of increased operations, as evidenced by an 18.8% increase in block
hours. Our average daily aircraft utilization in 2012 increased slightly compared to 2011. We estimate the fuel savings related
to the 136 flights cancellations due to Hurricane Sandy were approximately $0.6 million.
Total net loss recognized for hedges that settled during 2012 was $0.2 million, compared to a net loss of $7.4 million in
2011. These amounts represent the net cash paid (received) for the settlement of hedges.
Labor costs in 2012 increased by $37.2 million, or 20.5%, compared to 2011, primarily driven by a 22.4% increase in our
pilot and flight attendant workforce as we increased our fleet size by 21.6%, or eight aircraft, during 2012. During 2012, we
incurred an incremental $3.8 million of share-based compensation recorded within salaries, wages and benefits, driven
primarily by the commencement of the Performance Share Awards program in 2012.
During 2012, aircraft rent increased $27.1 million, or 23.3%, mainly due to the delivery of eight Airbus A320 aircraft
subsequent to the fourth quarter of 2011. All aircraft were financed through operating leases. The increase of aircraft rent
expense on a per-ASM basis is primarily due to the fact that we incurred $2.5 million of additional aircraft rent during
2012 related to a short-term lease agreement with a third-party provider (wet-leased aircraft) to maintain desired capacity
during the summer months.
Landing fees and other rents for 2012 increased by $15.6 million, or 29.5%, compared to 2011 primarily due to
a 19.9% increase in departures. On a per-ASM basis, the increase in landing fees and other rents of 7.1% during 2012 as
compared to the prior year period is due to increased volume at higher-cost airports, including the addition of six new airports
served in 2012, which on average are higher-cost airports than the system average.
The increase in distribution expense of $5.3 million, or 10.4%, in 2012 compared to 2011 was primarily due to increased
volume and an increase of approximately 4.1 percentage points year-over-year in the percentage of sales from third-party travel
agents, which are more expensive than sales directly through our website. This shift in distribution mix did not materially affect
operating income because the revenues received from sales through third-party travel agents are designed to at least offset the
associated incremental costs. The decrease on a per-unit basis is primarily due to a decrease of approximately 14% in credit
card fee rates period over period.
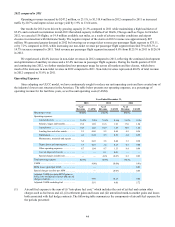
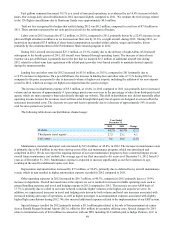
The following table shows our distribution channel usage:
Year Ended
December 31,
2012 2011 Change
Website . . . . . . . . . . . . . . . . . . . . . . . . . . . . . . . . . . . . . . . 64.2% 66.3% (2.1)
Third-party travel agents . . . . . . . . . . . . . . . . . . . . . . . . . . 27.2 23.1 4.1
Call center . . . . . . . . . . . . . . . . . . . . . . . . . . . . . . . . . . . . . 8.6 10.6 (2.0)
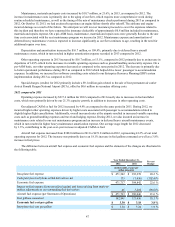
Maintenance, materials and repair costs increased by $15.4 million, or 45.4%, in 2012. The increase in maintenance costs
is primarily due to $6.8 million in one-time start-up costs of the seat maintenance program, which was introduced and
completed in 2012. We do not expect the ongoing expense of our seat maintenance program to have a material impact on our
overall future maintenance cost outlook. The average age of our fleet increased to 4.6 years as of December 31, 2012 from 4.5
years as of December 31, 2011. Maintenance expense is expected to increase significantly as our fleet continues to age,
resulting in the need for additional repairs over time.
Depreciation and amortization increased by $7.5 million, or 96.6%, primarily due to deferred heavy aircraft maintenance
events, which in turn resulted in higher amortization expense recorded in 2012 compared to 2011.
Other operating expenses in 2012 increased by $36.7 million, or 40.3%, compared to 2011 primarily due to a 19.9%
increase in departures. Overall increased rates at the airports we serve resulted in increased variable operating costs such as
ground handling expenses and travel and lodging expense in 2012 compared to 2011. The increase on a per-ASM basis of
17.7% is primarily due to a shift in our route network to include higher volumes at the higher-cost airports we serve. In
addition, we experienced increases in travel and lodging costs driven by both volume and hotel rate increases associated with
increased training and scope of operations, as well as higher passenger re-accommodation expenses associated with slightly
higher flight cancellations during 2012. We also incurred additional expenses related to the implementation of our ERP system.
Special charges (credits) for 2012 primarily include a $9.1 million gain related to the sale of four permanent air carrier
slots at Ronald Reagan National Airport (DCA), offset by $0.6 million in secondary offering costs. Special charges for 2011
relate to termination costs of $2.6 million in connection with our IPO, including $1.8 million paid to Indigo Partners, LLC to