Spirit Airlines 2013 Annual Report Download - page 34
Download and view the complete annual report
Please find page 34 of the 2013 Spirit Airlines annual report below. You can navigate through the pages in the report by either clicking on the pages listed below, or by using the keyword search tool below to find specific information within the annual report.-
 1
1 -
2
-
3
-
4
-
5
-
6
-
7
-
8
-
9
-
10
-
11
-
12
-
13
-
14
-
15
-
16
-
17
-
18
-
19
-
20
-
21
-
22
-
23
-
 24
24 -
 25
25 -
 26
26 -
 27
27 -
 28
28 -
 29
29 -
 30
30 -
 31
31 -
 32
32 -
 33
33 -
 34
34 -
 35
35 -
 36
36 -
 37
37 -
 38
38 -
 39
39 -
 40
40 -
 41
41 -
 42
42 -
 43
43 -
 44
44 -
45
-
46
-
47
-
48
-
49
-
50
-
51
-
52
-
53
-
54
-
55
-
56
-
57
-
58
-
59
-
60
-
61
-
62
-
63
-
64
-
65
-
66
-
67
-
68
-
69
-
70
-
71
-
72
-
73
-
74
-
75
-
76
-
77
-
78
-
79
-
80
-
81
-
82
-
83
-
84
-
85
-
86
-
87
-
88
-
89
-
90
-
91
-
92
-
93
-
94
-
95
 |
 |

34
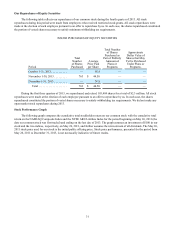
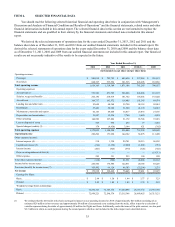
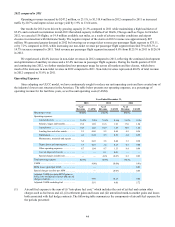
(2) Aircraft fuel expense is the sum of (i) “into-plane fuel cost,” which includes the cost of jet fuel and certain other charges such as fuel taxes and oil,
(ii) settlement gains and losses and (iii) unrealized mark-to-market gains and losses associated with fuel hedge contracts. The following table
summarizes the components of aircraft fuel expense for the periods presented:
Year Ended December 31,
2013 2012 2011 2010 2009
(in thousands)
Into-plane fuel cost. . . . . . . . . . . . . . . . . . . . . . . . . . . . . $ 542,523 $ 471,542 $ 392,278 $ 251,754 $ 181,806
Realized losses (gains) . . . . . . . . . . . . . . . . . . . . . . . . . . 8,958 175 (7,436) (1,483) 750
Unrealized losses (gains) . . . . . . . . . . . . . . . . . . . . . . . . 265 46 3,204 (2,065) (1,449)
Aircraft fuel expense . . . . . . . . . . . . . . . . . . . . . . . . . . . $ 551,746 $ 471,763 $ 388,046 $ 248,206 $ 181,107
(3) Special charges (credits) include: (i) for 2009, amounts relating to the early termination in mid-2008 of leases for seven Airbus A319 aircraft, a
related reduction in workforce and the exit facility costs associated with returning planes to lessors in 2008; (ii) for 2009 and 2010, amounts relating
to the sale of previously expensed MD-80 parts; (iii) for 2010 and 2011 amounts relating to exit facility costs associated with moving our Detroit,
Michigan maintenance operations to Fort Lauderdale, Florida; (iv) termination costs in connection with the IPO during the three months ended June
30, 2011 comprised of amounts paid to Indigo Partners, LLC to terminate its professional services agreement with us and fees paid to three
individual, unaffiliated holders of our subordinated notes; (v) for 2011 and 2012, a $9.1 million gain related to the sale of four permanent air carrier
slots at Ronald Reagan National Airport (DCA) offset by costs connected with the 2012 secondary offerings; and for 2013, costs related to the 2013
secondary offering. For more information, please see “Management’s Discussion and Analysis of Financial Condition and Results of Operations—
Our Operating Expenses—Special Charges (Credits).”
(4) Substantially all of the interest expense recorded in 2009, 2010 and 2011 relates to notes and preferred stock held by our principal stockholders that
were repaid or redeemed, or exchanged for shares of common stock, in connection with the Recapitalization in 2011 that was effected in connection
with the IPO. Interest expense in 2012 primarily relates to interest on PDPs and interest related to the TRA. Interest expense in 2013 primarily
relates to interest related to the TRA.
(5) Interest attributable to funds used to finance the acquisition of new aircraft, including PDPs is capitalized as an additional cost of the related asset.
Interest is capitalized at the weighted average implicit lease rate of our aircraft.
(6) Gain on extinguishment of debt represents the recognition of contingencies provided for in our 2006 recapitalization agreements, which provided
for the cancellation of shares of Class A preferred stock and reduction of the liquidation preference of the remaining Class A preferred stock and
associated accrued but unpaid dividends based on the outcome of the contingencies.
(7) Net income for 2010 includes a $52.3 million net tax benefit primarily due to the release of a valuation allowance resulting in a deferred tax benefit
of $52.8 million in 2010. Absent the release of the valuation allowance and corresponding tax benefit, our net income would have been $19.7
million for 2010.
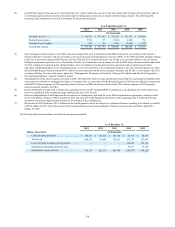
The following table presents balance sheet data for the periods presented.
As of December 31,
2013 2012 2011 2010 2009
Balance Sheet Data: (in thousands)
Cash and cash equivalents. . . . . . . . . . . . . . . . . . . . . $ 530,631 $ 416,816 $ 343,328 $ 82,714 $ 86,147
Total assets. . . . . . . . . . . . . . . . . . . . . . . . . . . . . . . . . 1,180,765 919,884 745,813 475,757 327,866
Long-term debt, including current portion . . . . . . . . — — — 260,827 242,232
Mandatorily redeemable preferred stock. . . . . . . . . . — — — 79,717 75,110
Stockholders' equity (deficit). . . . . . . . . . . . . . . . . . . 769,117 582,535 466,706 (105,077) (178,127)