Spirit Airlines 2013 Annual Report Download - page 36
Download and view the complete annual report
Please find page 36 of the 2013 Spirit Airlines annual report below. You can navigate through the pages in the report by either clicking on the pages listed below, or by using the keyword search tool below to find specific information within the annual report.-
 1
1 -
2
-
3
-
4
-
5
-
6
-
7
-
8
-
9
-
10
-
11
-
12
-
13
-
14
-
15
-
16
-
17
-
18
-
19
-
20
-
21
-
22
-
23
-
24
-
25
-
 26
26 -
 27
27 -
 28
28 -
 29
29 -
 30
30 -
 31
31 -
 32
32 -
 33
33 -
 34
34 -
 35
35 -
 36
36 -
 37
37 -
 38
38 -
 39
39 -
 40
40 -
 41
41 -
 42
42 -
 43
43 -
 44
44 -
 45
45 -
 46
46 -
47
-
48
-
49
-
50
-
51
-
52
-
53
-
54
-
55
-
56
-
57
-
58
-
59
-
60
-
61
-
62
-
63
-
64
-
65
-
66
-
67
-
68
-
69
-
70
-
71
-
72
-
73
-
74
-
75
-
76
-
77
-
78
-
79
-
80
-
81
-
82
-
83
-
84
-
85
-
86
-
87
-
88
-
89
-
90
-
91
-
92
-
93
-
94
-
95
 |
 |
36
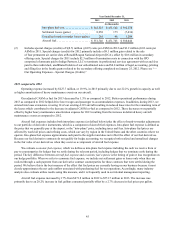
ITEM 7. MANAGEMENT’S DISCUSSION AND ANALYSIS OF FINANCIAL CONDITION AND RESULTS OF
OPERATIONS
You should read the following discussion of our financial condition and results of operations in conjunction with the financial
statements and the notes thereto included elsewhere in this annual report.
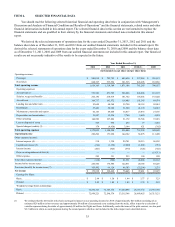
2013 Year in Review
The year 2013 marks the seventh consecutive year of profitability and one of the most successful years on record for
us. We achieved earnings of $176.9 million ($2.42 per share, diluted), compared to net income of $108.5 million ($1.49 per
share, diluted) in 2012. The increase in our 2013 net income is a result of our increased capacity, continued strong demand for
our ultra-low fares and growth in our ancillary revenues.
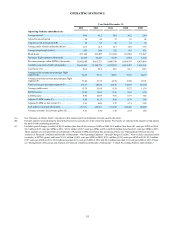
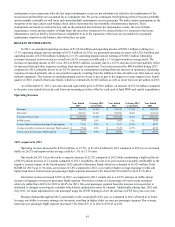
For the year ended December 31, 2013, we achieved record annual profits and a 17.1% operating profit margin, the
highest in our history, on $1,654.4 million in operating revenues. Our traffic grew by 24.2% as we continued to stimulate
demand with ultra-low fares. Total revenue per passenger flight segment increased by 5.4% from $126.50 to $133.27. Total
RASM for 2013 was 11.94 cents, an increase of 2.8% compared to the prior year period, as a result of both higher average
passenger yields and increased load factors. Strength in demand throughout 2013 allowed us to leverage our ability to revenue
manage our inventory, resulting in increased profitability year over year.
Our operating cost structure is a primary area of focus and is at the core of our ULCC business model in which we
compete solely on the basis of price. Spirit's unit operating costs continue to be among the lowest of any airline in the
Americas. During 2013, we increased our capacity by 22.2% as we grew our fleet of Airbus single-aisle aircraft from 45 to 54,
added 25 new nonstop routes during the year, and launched service to two new destinations: New Orleans, Louisiana and
Philadelphia, Pennsylvania.
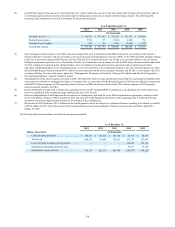
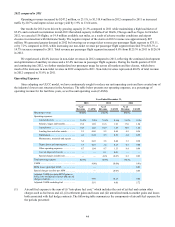
During 2013, we increased our average non-ticket revenue per passenger flight segment by 4.8%, or $2.45, to $53.84.
Our total non-ticket revenue increased by 24.8%, or $132.8 million, to $668.4 million in 2013. The year-over-year increase in
average non-ticket revenue per passenger flight segment was primarily driven by changes we made late in 2012 to our bag fee
schedule to optimize revenue by channel, a change we made in July 2013 to align our foreign passenger usage fee with our
domestic passenger usage fee, and an increase in service charges collected as a result of increased volume of third-party
bookings. Growth in travel package sales including the offering of third-party travel-related options such as hotels and rental
cars for sale through our website, subscriptions to our $9 Fare Club and other options designed to enhance our customers' travel
experience also contributed to the growth of our non-ticket revenue.
During 2013, our adjusted CASM ex-fuel decreased by 1.5% to 5.91 cents. Better operational performance during
2013 as compared to 2012 helped drive lower wages and passenger re-accommodation expenses. In addition, during 2013, we
entered into lease extensions covering 14 of our existing A319 aircraft resulting in reduced lease rates for the remaining term of
the leases which contributed to the decrease in adjusted CASM ex-fuel as compared to 2012. These decreases were partially
offset by higher heavy maintenance amortization expense for 2013 resulting from the increase in deferred heavy aircraft
maintenance events as compared to the same period in 2012.
During 2013, we reached a Company milestone with the introduction of the 50th aircraft into our operating fleet. As of
December 31, 2013, our 54 Airbus A320-family aircraft fleet was comprised of 29 A319s, 23 A320s and 2 A321s. As of
December 31, 2013, our aircraft orders consisted of 112 A320 family aircraft with Airbus and 5 direct operating leases for
A320neos with a third party, scheduled for delivery from 2014 through 2021. Our plan calls for growing the fleet by 20.4% in
2014.
2011 IPO
On June 1, 2011, we completed our initial public offering of common stock, or IPO, which raised net proceeds of $150.0
million after repayment of debt, payment of transaction expenses and other fees. In connection with the IPO, we effected a
recapitalization, which we refer to as the 2011 Recapitalization, that resulted in the repayment or conversion of all of our notes
and shares of preferred stock into shares of common stock.
Our Operating Revenues
Our operating revenues are comprised of passenger revenues and non-ticket revenues.
Passenger Revenues. Passenger revenues consist of the base fares that customers pay for air travel.