Spirit Airlines 2013 Annual Report Download - page 46
Download and view the complete annual report
Please find page 46 of the 2013 Spirit Airlines annual report below. You can navigate through the pages in the report by either clicking on the pages listed below, or by using the keyword search tool below to find specific information within the annual report.-
 1
1 -
2
-
3
-
4
-
5
-
6
-
7
-
8
-
9
-
10
-
11
-
12
-
13
-
14
-
15
-
16
-
17
-
18
-
19
-
20
-
21
-
22
-
23
-
24
-
25
-
26
-
27
-
28
-
29
-
30
-
31
-
32
-
33
-
34
-
35
-
 36
36 -
 37
37 -
 38
38 -
 39
39 -
 40
40 -
 41
41 -
 42
42 -
 43
43 -
 44
44 -
 45
45 -
 46
46 -
 47
47 -
 48
48 -
 49
49 -
 50
50 -
 51
51 -
 52
52 -
 53
53 -
 54
54 -
 55
55 -
 56
56 -
57
-
58
-
59
-
60
-
61
-
62
-
63
-
64
-
65
-
66
-
67
-
68
-
69
-
70
-
71
-
72
-
73
-
74
-
75
-
76
-
77
-
78
-
79
-
80
-
81
-
82
-
83
-
84
-
85
-
86
-
87
-
88
-
89
-
90
-
91
-
92
-
93
-
94
-
95
 |
 |

46
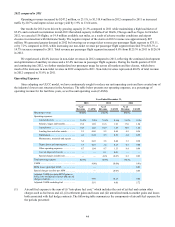
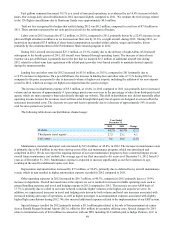
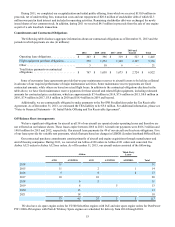
The difference between aircraft fuel expense and economic fuel expense and the elements of the changes are illustrated in
the following table:
Year Ended December 31, Percent
Change
2013 2012
(in thousands, except per
gallon amounts)
Into-plane fuel expense $ 542,523 $ 471,542 15.1 %
Cash paid (received) from settled derivatives, net 8,958 175 5,018.9 %
Economic fuel expense 551,481 471,717 16.9 %
Impact on fuel expense from unrealized (gains) and losses arising from mark-to-
market adjustments to our outstanding fuel derivatives 265 46 476.1 %
Aircraft fuel expense (per Statement of Operations) $ 551,746 $ 471,763 17.0 %
Fuel gallons consumed 171,931 142,991 20.2 %
Economic fuel cost per gallon $ 3.21 $ 3.30 (2.7)%
Into-plane fuel cost per gallon $ 3.16 $ 3.30 (4.2 )%
Fuel gallons consumed increased 20.2% as a result of increased operations, as evidenced by a 20.1% increase in block
hours.
Total net loss recognized for hedges that settled during 2013 was $9.0 million, compared to a net loss of $0.2 million in
2012. These amounts represent the net cash paid (received) for the settlement of hedges.
Labor costs in 2013 increased by $43.2 million, or 19.7%, compared to 2012, due mainly to a 30.9% increase in our pilot
and flight attendant workforce required to operate the nine new aircraft deliveries in 2013. On a per-ASM basis, labor costs
decreased as a result of better operational performance during 2013 as compared to 2012, which helped drive lower crew-
related salary expenses during 2013.
During 2013, aircraft rent increased $26.2 million, or 18.2%, compared to 2012. This increase was primarily driven by
the delivery of nine new aircraft during 2013. On a per-ASM basis, aircraft rent expense decreased as a result of the
modification and extension of 14 A319 aircraft leases. The modification resulted in reduced lease rates for the remaining term
of these leases. This reduction was slightly offset by higher supplemental rent on three 40-month aircraft leases taken during
late 2012 and early 2013.
Landing fees and other rents for 2013 increased by $15.2 million, or 22.3%, compared to 2012 primarily due to
a 14.9% increase in departures as well as increased volume at higher cost airports. On a per-ASM basis, landing fees and other
rents remained flat as increased volume at higher-cost airports were offset by the increase in capacity which outpaced the
increase of departures due to higher stage length year over year.
The increase in distribution expense of $10.8 million, or 19.1%, in 2013 compared to 2012 was primarily due to
increased sales volume driving up credit card fees as well as an increase of approximately 6.3 percentage points year-over-year
in the percentage of sales from third-party travel agents, which are more expensive than sales directly through our website. This
shift in distribution mix did not materially affect operating income because the revenues received from sales through third-party
travel agents are designed to at least offset the associated incremental costs. On a per-ASM basis, distribution expense was
relatively flat as credit card fee rates remained stable period over period.
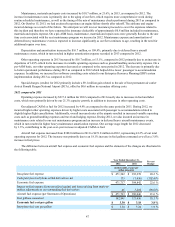
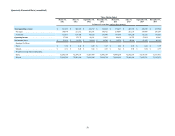
The following table shows our distribution channel usage:
Year Ended
December 31,
2013 2012 Change
Website . . . . . . . . . . . . . . . . . . . . . . . . . . . . . . . . . . . . . . . 61.0% 64.2% (3.2)
Third-party travel agents . . . . . . . . . . . . . . . . . . . . . . . . . . 33.5 27.2 6.3
Call center . . . . . . . . . . . . . . . . . . . . . . . . . . . . . . . . . . . . . 5.5 8.6 (3.1)