Spirit Airlines 2013 Annual Report Download - page 44
Download and view the complete annual report
Please find page 44 of the 2013 Spirit Airlines annual report below. You can navigate through the pages in the report by either clicking on the pages listed below, or by using the keyword search tool below to find specific information within the annual report.-
 1
1 -
2
-
3
-
4
-
5
-
6
-
7
-
8
-
9
-
10
-
11
-
12
-
13
-
14
-
15
-
16
-
17
-
18
-
19
-
20
-
21
-
22
-
23
-
24
-
25
-
26
-
27
-
28
-
29
-
30
-
31
-
32
-
33
-
 34
34 -
 35
35 -
 36
36 -
 37
37 -
 38
38 -
 39
39 -
 40
40 -
 41
41 -
 42
42 -
 43
43 -
 44
44 -
 45
45 -
 46
46 -
 47
47 -
 48
48 -
 49
49 -
 50
50 -
 51
51 -
 52
52 -
 53
53 -
 54
54 -
55
-
56
-
57
-
58
-
59
-
60
-
61
-
62
-
63
-
64
-
65
-
66
-
67
-
68
-
69
-
70
-
71
-
72
-
73
-
74
-
75
-
76
-
77
-
78
-
79
-
80
-
81
-
82
-
83
-
84
-
85
-
86
-
87
-
88
-
89
-
90
-
91
-
92
-
93
-
94
-
95
 |
 |
44
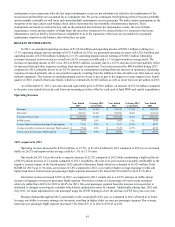
2012 compared to 2011
Operating revenues increased by $247.2 million, or 23.1%, to $1,318.4 million in 2012 compared to 2011 as increased
traffic by 20.7% and improved our average yield by 1.9% to 13.64 cents.
Our results for 2012 were driven by growing capacity 21.3% compared to 2011 while maintaining a high load factor of
85.2% and a network reorientation in mid-2011 that added capacity in Dallas-Fort Worth, Chicago and Las Vegas. In October
2012, we canceled 136 flights, or 19.9 million available seat miles, as a result of adverse weather conditions and airport
closures in connection with Hurricane Sandy. The negative impact of the storm on 2012 revenue was approximately $25
million. We generated greater demand in 2012 by lowering our average ticket revenue per passenger flight segment to $75.11,
or by 7.2% compared to 2011, while increasing our non-ticket revenue per passenger flight segment from $44.79 to $51.39, a
14.7% increase compared to 2011. Total revenue per passenger flight segment increased 0.6% from $125.76 in 2011 to $126.50
in 2012.
We experienced a 40.4% increase in non-ticket revenues in 2012 compared to 2011, reflecting the continued development
and optimization of ancillary revenues and a 22.4% increase in passenger flight segments. During the fourth quarter of 2011
and continuing into 2012, we further standardized our passenger usage fee across all markets and fare classes, which drove
much of the increases in non-ticket revenue in 2012 compared to 2011. Non-ticket revenue represented 40.6% of total revenue
in 2012 compared to 35.6% in 2011.
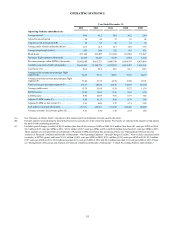
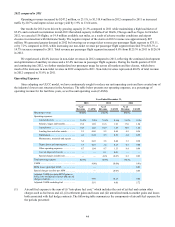
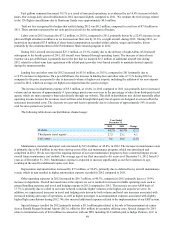
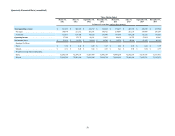
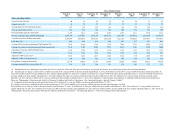
Operating Expenses
Since adopting our ULCC model, we have continuously sought to reduce our unit operating costs and have created one of
the industry's lowest cost structures in the Americas. The table below presents our operating expenses, as a percentage of
operating revenue for the last three years, as well as unit operating costs (CASM).
Year Ended December 31,
2013 2012 2011
% of
Revenue CASM % of
Revenue CASM % of
Revenue CASM
Operating revenue 100.0% 100.0% 100.0%
Operating expenses:
Aircraft fuel (1) . . . . . . . . . . . . . . . . . . 33.4% 3.98¢ 35.8% 4.16¢ 36.2% 4.15¢
Salaries, wages and benefits. . . . . . . . . 15.8 1.89 16.6 1.93 17.0 1.94
Aircraft rent . . . . . . . . . . . . . . . . . . . . . 10.3 1.22 10.9 1.27 10.9 1.25
Landing fees and other rentals . . . . . . . 5.1 0.60 5.2 0.60 4.9 0.56
Distribution. . . . . . . . . . . . . . . . . . . . . . 4.1 0.49 4.3 0.50 4.8 0.55
Maintenance, materials and repairs . . . 3.6 0.43 3.8 0.44 3.3 0.38
Depreciation and amortization . . . . . . . 1.9 0.23 1.2 0.13 0.7 0.08
Other operating expenses . . . . . . . . . . . 8.7 1.04 9.7 1.13 8.4 0.96
Loss on disposal of assets. . . . . . . . . . . — — 0.1 0.01 — —
Special charges (credits) (2). . . . . . . . . — — (0.6) (0.07) 0.3 0.03
Total operating expense 82.9% 86.8% 86.5%
CASM . . . . . . . . . . . . . . . . . . . . . . . . . . . . . . 9.90¢ 10.09¢ 9.91¢
MTM losses (gains)per ASM . . . . . . . . . . . . — — 0.03
Special charges (credits) per ASM . . . . . . . . — (0.07) 0.03
Adjusted CASM (excludes MTM gains or
losses, loss on disposal of assets and special
charges (credits)). . . . . . . . . . . . . . . . . . . . . . 9.89 10.15 9.84
Adjusted CASM excluding fuel . . . . . . . . . . 5.91 6.00 5.72
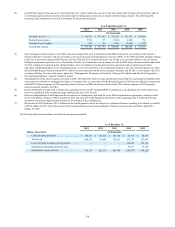
(1) Aircraft fuel expense is the sum of (i) “into-plane fuel cost,” which includes the cost of jet fuel and certain other
charges such as fuel taxes and oil, (ii) settlement gains and losses and (iii) unrealized mark-to-market gains and losses
both associated with fuel hedge contracts. The following table summarizes the components of aircraft fuel expense for
the periods presented: