Red Lobster 2007 Annual Report Download - page 8
Download and view the complete annual report
Please find page 8 of the 2007 Red Lobster annual report below. You can navigate through the pages in the report by either clicking on the pages listed below, or by using the keyword search tool below to find specific information within the annual report.-
 1
1 -
 2
2 -
 3
3 -
 4
4 -
 5
5 -
 6
6 -
 7
7 -
 8
8 -
 9
9 -
 10
10 -
 11
11 -
 12
12 -
 13
13 -
 14
14 -
 15
15 -
 16
16 -
 17
17 -
 18
18 -
 19
19 -
20
-
21
-
22
-
23
-
24
-
25
-
26
-
27
-
28
-
29
-
30
-
31
-
32
-
33
-
34
-
35
-
36
-
37
-
38
-
39
-
40
-
41
-
42
-
43
-
44
-
45
-
46
-
47
-
48
-
49
-
50
-
51
-
52
-
53
-
54
-
55
-
56
-
57
-
58
-
59
-
60
-
61
-
62
-
63
-
64
 |
 |

6
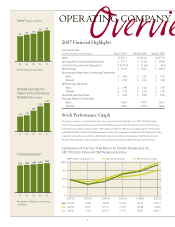
Financial Highlights
Financially, our results from continuing operations for scal
2007 were competitively superior in what was clearly a chal-
lenging industry environment. Financial highlights include
the following:
• Sales from continuing operations increased 4.0 percent
to $5.57 billion for scal 2007, driven by new restaurant
growth at Olive Garden and same-restaurant sales growth
at Olive Garden and Red Lobster.
• Net earnings from continuing operations for scal 2007
were $377.1 million, a 7.2 percent increase from scal 2006
net earnings from continuing operations of $351.8 million.
Diluted net earnings per share from continuing operations
were $2.53, a 13 percent increase from diluted net earnings
per share from continuing operations of $2.24 in scal 2006.
• Olive Garden’s total sales were a record $2.79 billion, up
6.6 percent from scal 2006. This reected record average
annual sales per restaurant of $4.7 million, the addition of
32 net new restaurants and U.S. same-restaurant sales
growth of 2.7 percent. Olive Garden also reported their
51st consecutive quarter of U.S. same-restaurant sales
increases in the fourth quarter of scal 2007.
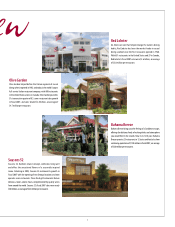
• Red Lobster’s total sales were a record $2.60 billion, an
increase of 0.9 percent from scal 2006. Average annual
sales per restaurant were $3.8 million, and U.S. same-
restaurant sales growth for scal 2007 was 0.2 percent.
• Bahama Breeze’s sales from continuing operations were
$138 million in scal 2007, which was 0.9 percent above
scal 2006. Same-restaurant sales at Bahama Breeze
increased 0.9 percent in scal 2007 and average annual
sales per restaurant were $6.0 million. Bahama Breeze’s
operating results from continuing operations were
strong with unit-level returns approaching those of our
larger brands.
• Seasons 52’s total sales were nearly $40 million in
scal 2007. Two additional restaurants opened in scal
2007, bringing the total number in operation to seven.
In March 2007, we announced that Seasons 52 would
begin the next phase of its development, which includes
continuing to operate its seven existing restaurants with
excellence while developing the real estate and talent
pipelines for another three or so openings over the next
two years.
• With our strong cash ows and balance sheet, we spent
$371 million to repurchase 9.4 million shares of our
common stock in scal 2007. Since beginning our share
repurchase program in 1995, we have repurchased
more than 141.9 million shares of our common stock
for $2.62 billion.
We are focused
on accelerating
profitable sales growth
to further leverage the
competitively superior
and increasingly strong
operating platform
we’ve built.