Red Lobster 2007 Annual Report Download - page 29
Download and view the complete annual report
Please find page 29 of the 2007 Red Lobster annual report below. You can navigate through the pages in the report by either clicking on the pages listed below, or by using the keyword search tool below to find specific information within the annual report.-
 1
1 -
2
-
3
-
4
-
5
-
6
-
7
-
8
-
9
-
10
-
11
-
12
-
13
-
14
-
15
-
16
-
17
-
18
-
 19
19 -
 20
20 -
 21
21 -
 22
22 -
 23
23 -
 24
24 -
 25
25 -
 26
26 -
 27
27 -
 28
28 -
 29
29 -
 30
30 -
 31
31 -
 32
32 -
 33
33 -
 34
34 -
 35
35 -
 36
36 -
 37
37 -
 38
38 -
 39
39 -
40
-
41
-
42
-
43
-
44
-
45
-
46
-
47
-
48
-
49
-
50
-
51
-
52
-
53
-
54
-
55
-
56
-
57
-
58
-
59
-
60
-
61
-
62
-
63
-
64
 |
 |

M
Darden Restaurants, Inc. Annual Report 2007 27
Management’s Discussion and Analysis of Financial Condition and
Results of Operations
Our defined benefit and other postretirement benefit costs and
liabilities are determined using various actuarial assumptions and
methodologies prescribed under the Financial Accounting Standards
Board’s (FASB) SFAS No. 87, “Employers’ Accounting for Pensions” and
No. 106, “Employers’ Accounting for Postretirement Benefits Other
Than Pensions.” We use certain assumptions including, but not limited
to, the selection of a discount rate, expected long-term rate of return
on plan assets and expected health care cost trend rates. We set the
discount rate assumption annually for each plan at its valuation date
to reflect the yield of high quality fixed-income debt instruments, with
lives that approximate the maturity of the plan benefits. At May 27,
2007, our discount rate was 5.80 percent. The expected long-term
rate of return on plan assets and health care cost trend rates are based
upon several factors, including our historical assumptions compared
with actual results, an analysis of current market conditions, asset
allocations and the views of leading financial advisers and econo-
mists. Our assumed expected long-term rate of return on plan assets
was 9.0 percent for each of the fiscal years reported. At May 27, 2007,
the expected health care cost trend rates assumed for fiscal 2008
ranged from 9.0 percent to 10.0 percent, depending on the medical
service category. The rates gradually decrease to 5.0 percent through
fiscal 2012 and remain at that level thereafter. We made contributions
of approximately $0.5 million, $0.3 million and $0.1 million in fiscal
years 2007, 2006 and 2005, respectively, to our defined benefit
pension plan to maintain its fully funded status as of each annual
valuation date (the most recent of which was February 28, 2007).
The expected long-term rate of return on plan assets
component of our net periodic benefit cost is calculated based on
the market-related value of plan assets. Our target asset allocation
is 35 percent U.S. equities, 30 percent high-quality, long-duration
fixed-income securities, 15 percent international equities, 10 percent
private equities and 10 percent real assets. We monitor our actual
asset allocation to ensure that it approximates our target allocation
and believe that our long-term asset allocation will continue to
approximate our target allocation. Our historical ten-year rate of
return on plan assets, calculated using the geometric method
average of returns, is approximately 11.0 percent as of May 27, 2007.
We have recognized net actuarial losses as a component of
accumulated other comprehensive income (loss) for the defined
benefit plans and postretirement benefit plan as of May 27, 2007 of
$35.4 million and $5.7 million, respectively. These net actuarial losses
represent changes in the amount of the projected benefit obligation
and plan assets resulting from differences in the assumptions used
and actual experience. The amortization of the net actuarial loss
component of our fiscal 2008 net periodic benefit cost for the defined
benefit plans and postretirement benefit plan is expected to be
approximately $4.3 million and $0.3 million, respectively.
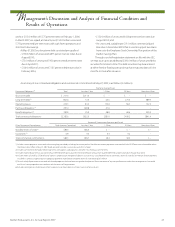
We believe our defined benefit and postretirement benefit
plan assumptions are appropriate based upon the factors discussed
above. However, other assumptions could also be reasonably applied
that could differ from the assumptions used. A quarter-percentage
point change in the defined benefit plans’ discount rate and the
expected long-term rate of return on plan assets would increase
or decrease earnings before income taxes by $0.6 million and
$0.4 million, respectively. A quarter-percentage point change in our
postretirement benefit plan discount rate would increase or decrease
earnings before income taxes by $0.1 million. A one-percentage
point increase in the health care cost trend rates would increase
the accumulated postretirement benefit obligation (APBO) by
$4.5 million at May 27, 2007 and the aggregate of the service cost and
interest cost components of net periodic postretirement benefit cost
by $0.7 million for fiscal 2007. A one-percentage point decrease in the
health care cost trend rates would decrease the APBO by $3.0 million
at May 27, 2007 and the aggregate of the service cost and interest
cost components of net periodic postretirement benefit cost by
$0.5 million for fiscal 2007. These changes in assumptions would
not significantly impact our funding requirements.
We are not aware of any trends or events that would materially
affect our capital requirements or liquidity. We believe that our
internal cash-generating capabilities, borrowings available under
our shelf registration for unsecured debt securities and short-term
commercial paper program should be sufficient to finance our capital
expenditures, debt maturities, stock repurchase program and other
operating activities through fiscal 2008.
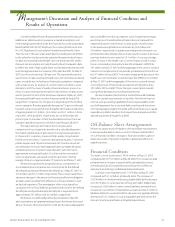
Off-Balance Sheet Arrangements
We are not a party to any off-balance sheet arrangements that have,
or are reasonably likely to have, a current or future material effect
on our financial condition, changes in financial condition, sales or
expenses, results of operations, liquidity, capital expenditures or
capital resources.
Financial Condition
Our total current assets were $545.4 million at May 27, 2007,
compared with $377.6 million at May 28, 2006. The increase resulted
primarily from an increase in assets held for sale related to closing
or holding for sale all Smokey Bones and Rocky River Grillhouse
restaurants and closing nine Bahama Breeze restaurants.
Our total current liabilities were $1.07 billion at May 27, 2007,
compared with $1.03 billion at May 28, 2006. The increase of
$167.4 million in short term debt was partially offset by the decrease
of $149.9 million in current portion of long-term debt. Additionally,
increases of $12.8 million in other current liabilities, primarily due to
increases in our workers’ compensation accruals, and $42.3 million in
liabilities related to our assets held for sale were only partially offset by
decreases of $35.2 million in accounts payable, primarily due to the
timing of inventory purchases and capital expenditures.