Red Lobster 2007 Annual Report Download - page 4
Download and view the complete annual report
Please find page 4 of the 2007 Red Lobster annual report below. You can navigate through the pages in the report by either clicking on the pages listed below, or by using the keyword search tool below to find specific information within the annual report.-
 1
1 -
 2
2 -
 3
3 -
 4
4 -
 5
5 -
 6
6 -
 7
7 -
 8
8 -
 9
9 -
 10
10 -
 11
11 -
 12
12 -
 13
13 -
 14
14 -
 15
15 -
16
-
17
-
18
-
19
-
20
-
21
-
22
-
23
-
24
-
25
-
26
-
27
-
28
-
29
-
30
-
31
-
32
-
33
-
34
-
35
-
36
-
37
-
38
-
39
-
40
-
41
-
42
-
43
-
44
-
45
-
46
-
47
-
48
-
49
-
50
-
51
-
52
-
53
-
54
-
55
-
56
-
57
-
58
-
59
-
60
-
61
-
62
-
63
-
64
 |
 |
2
4.5
5.0
5.6
5.4
4.8
‘03 ‘04 ‘05 ‘06 ‘07
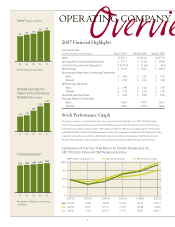
2007 Financial Highlights
Fiscal Year Ended
(In millions, except per share amounts) May 27, 2007 May 28, 2006 May 29, 2005
Sales $ 5,567.1 $ 5,353.6 $ 4,977.6
Earnings from Continuing Operations $ 377.1 $ 351.8 $ 299.9
Loss from Discontinued Operations $ (175.7) $ (13.6) $ (9.3)
Net Earnings $ 201.4 $ 338.2 $ 290.6
Earnings per Share from Continuing Operations
Basic $ 2.63 $ 2.35 $ 1.91
Diluted $ 2.53 $ 2.24 $ 1.84
Net Earnings per Share:
Basic $ 1.40 $ 2.26 $ 1.85
Diluted $ 1.35 $ 2.16 $ 1.78
Dividends Paid per Share $ 0.46 $ 0.40 $ 0.08
Average Shares Outstanding:
Basic 143.4 149.7 156.7
Diluted 148.8 156.9 163.4
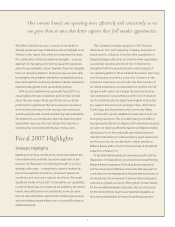
Overview
OPERATING COMPANY
Sales* [dollars in billions]
1.31
1.84
2.53
2.24
1.43
‘03 ‘04 ‘05 ‘06 ‘07
Diluted Earnings Per
Share From Continuing
Operations [in dollars]
$200
150
100
50
0
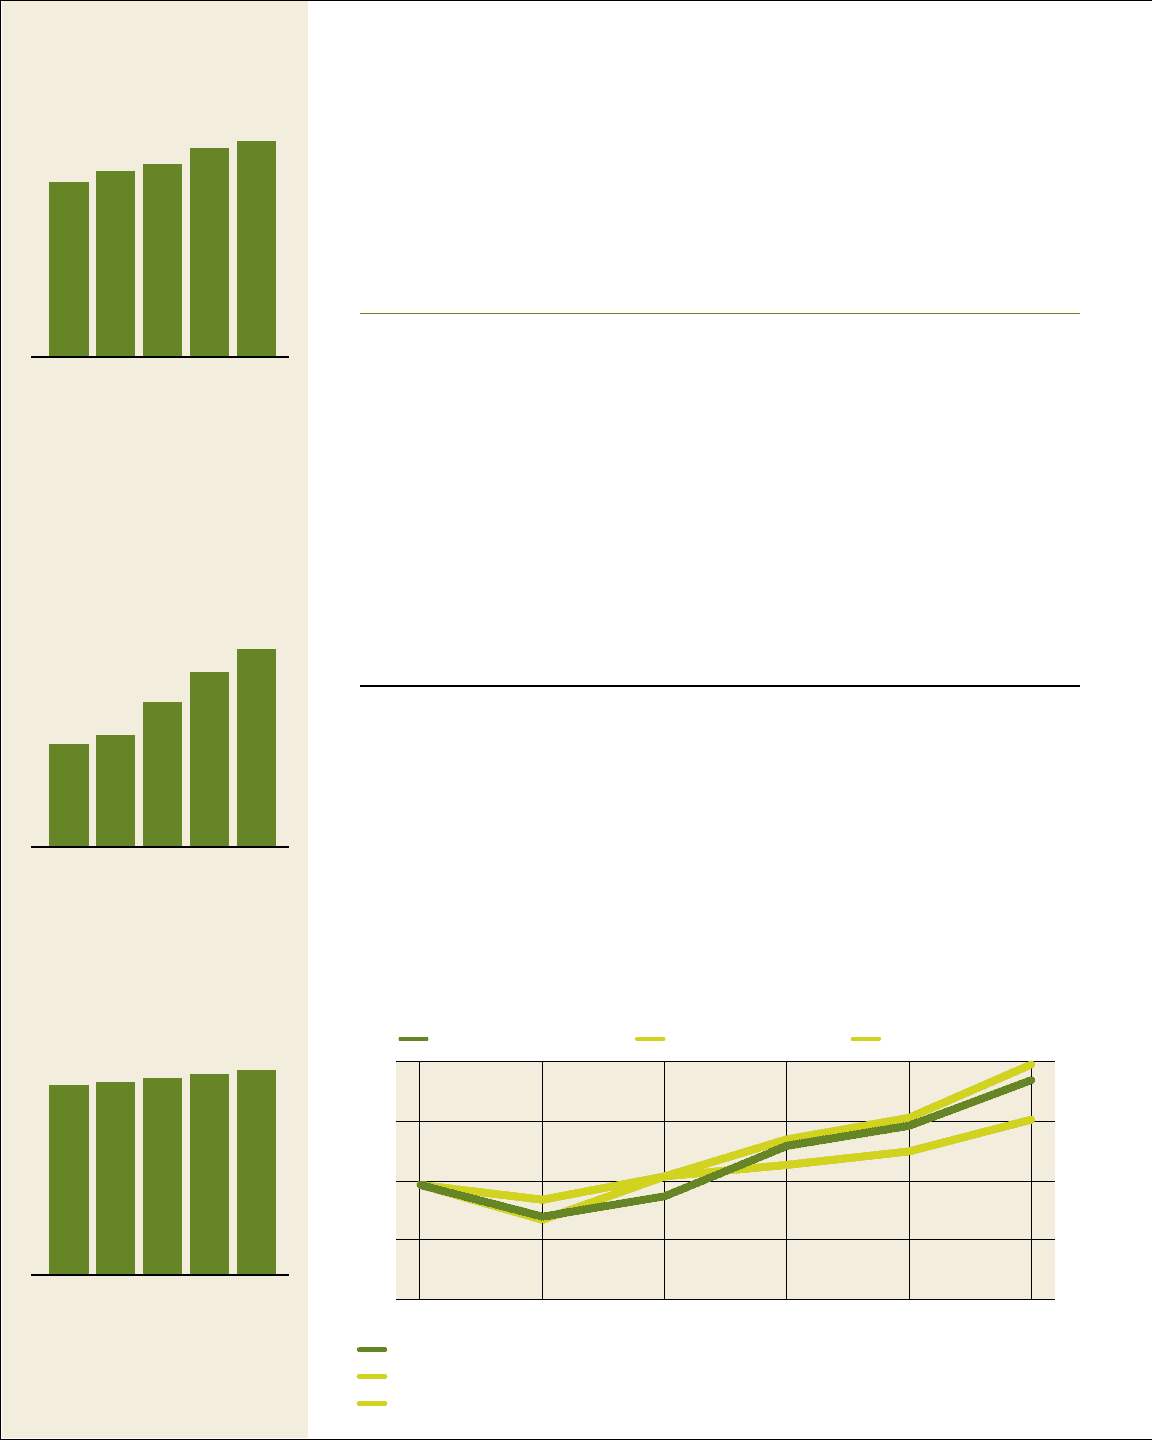
Darden Restaurants, Inc. S&P 500 Stock Index S&P Restaurants Index
Comparison of Five-Year Total Return for Darden Restaurants, Inc.,
S&P 500 Stock Index and S&P Restaurants Index
5/26/02 5/25/03 5/30/04 5/29/05 5/28/06 5/27/07
100.00 73.60 90.58 132.43 149.13 187.10
100.00 87.67 107.14 116.67 127.88 154.27
100.00 71.06 107.09 137.93 155.87 200.17
Stock Performance Graph
This graph compares our total shareholder returns against the Standard & Poor’s (“S&P”) 500 Stock Index
and our industry peer group as measured by the S&P Restaurants Index. The graph assumes that $100 was
invested in our common shares and the other indices on May 24, 2002, the last trading day for our scal year
ended May 26, 2002, and that all dividends were reinvested. The companies included in the S&P Restaurants Index,
in addition to Darden, were as follows: McDonald’s Corporation; Starbucks Corporation; YUM! Brands, Inc.; and
Wendy’s International, Inc. The stock prices shown are historical and do not determine future performance.
*From continuing operations
Total Restaurants*
1,223 1,268 1,324
1,292
1,247
‘03 ‘04 ‘05 ‘06 ‘07
* Restaurants included in continuing
operations