Red Lobster 2007 Annual Report Download - page 50
Download and view the complete annual report
Please find page 50 of the 2007 Red Lobster annual report below. You can navigate through the pages in the report by either clicking on the pages listed below, or by using the keyword search tool below to find specific information within the annual report.-
 1
1 -
2
-
3
-
4
-
5
-
6
-
7
-
8
-
9
-
10
-
11
-
12
-
13
-
14
-
15
-
16
-
17
-
18
-
19
-
20
-
21
-
22
-
23
-
24
-
25
-
26
-
27
-
28
-
29
-
30
-
31
-
32
-
33
-
34
-
35
-
36
-
37
-
38
-
39
-
 40
40 -
 41
41 -
 42
42 -
 43
43 -
 44
44 -
 45
45 -
 46
46 -
 47
47 -
 48
48 -
 49
49 -
 50
50 -
 51
51 -
 52
52 -
 53
53 -
 54
54 -
 55
55 -
 56
56 -
 57
57 -
 58
58 -
 59
59 -
 60
60 -
61
-
62
-
63
-
64
 |
 |

48 Darden Restaurants, Inc. Annual Report 2007
Notes to Consolidated Financial Statements
N
then acquired, each right will entitle the holder (other than the
acquiring company) to receive, upon exercise, common stock of
either us or the acquiring company having a value equal to two
times the exercise price of the right. The rights are redeemable by
our Board of Directors under certain circumstances and expire on
May 25, 2015.
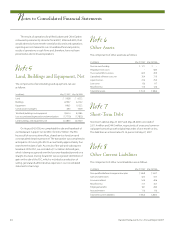
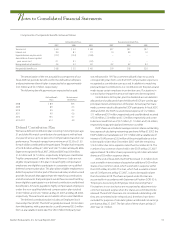
Accumulated Other
Comprehensive Income (Loss)
The components of accumulated other comprehensive income
(loss) are as follows:
(in millions) May 27, 2007 May 28, 2006
Foreign currency translation adjustment $ (4.3) $(4.8)
Unrealized gains (losses) on derivatives, net of tax 3.8 (0.2)
Minimum pension liability adjustment, net of tax – (0.5)
Adoption of SFAS No. 158, net of tax (32.3) –
Total accumulated other comprehensive
income (loss) $(32.8) $(5.5)
Reclassification adjustments associated with pre-tax net
derivative income (losses) realized in net earnings for fiscal 2007,
2006 and 2005 amounted to ($1.3) million, $5.0 million and $0.2 million,
respectively. The amortization of the unrecognized net actuarial loss
component of our fiscal 2008 net periodic benefit cost for the defined
benefit plans and postretirement benefit plan is expected to be
approximately $4.3 million and $0.3 million, respectively.
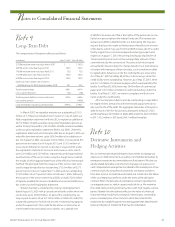
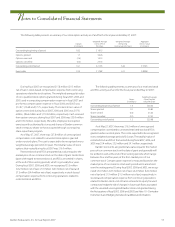
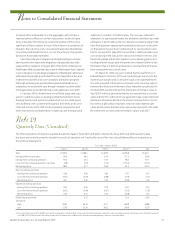
Note13
Leases
An analysis of rent expense incurred under operating leases related
to restaurants in continuing operations is as follows:
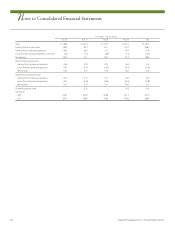
Fiscal Year
(in millions) 2007 2006 2005
Restaurant minimum rent $64.3 $59.9 $57.0
Restaurant percentage rent 4.6 4.6 4.0
Restaurant rent averaging expense (2.5) 5.4 5.1
Transportation equipment 2.8 2.3 2.8
Office equipment 1.1 1.1 1.2
Office space 5.3 1.3 1.1
Warehouse space 0.3 0.3 0.3
Total rent expense $75.9 $74.9 $71.5
Rent expense included in discontinued operations was
$4.4 million, $9.2 million and $8.0 million for fiscal 2007, 2006 and
2005, respectively. The annual non-cancelable future lease commit-
ments, including those related to restaurants reported as discon-
tinued operations, for each of the five fiscal years subsequent to
May 27, 2007 and thereafter are: $81.5 million in 2008, $73.7 million
in 2009, $61.3 million in 2010, $53.1 million in 2011, $43.2 million
in 2012 and $122.5 million thereafter, for a cumulative total of
$435.3 million.
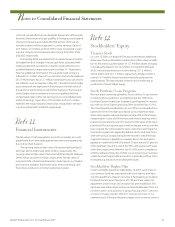
Note14
Interest, Net
The components of interest, net, are as follows:
Fiscal Year
(in millions) 2007 2006 2005
Interest expense $43.6 $48.9 $47.7
Capitalized interest (2.9) (1.9) (1.6)
Interest income (0.6) (3.1) (1.4)
Interest, net $40.1 $43.9 $44.7
Capitalized interest was computed using our average borrowing
rate. We paid $35.8 million, $40.3 million and $39.1 million for interest
(net of amounts capitalized) in fiscal 2007, 2006 and 2005, respectively.
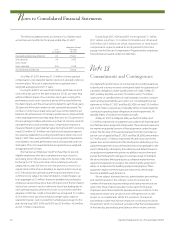
Note15
Income Taxes
Total income tax expense for fiscal 2007, 2006 and 2005 was allocated
as follows:
Fiscal Year
(in millions) 2007 2006 2005
Earnings from continuing operations $ 153.7 $156.3 $141.7
Losses from discontinued operations (112.9) (12.1) (8.3)
Total consolidated income tax expense $ 40.8 $144.2 $133.4