Red Lobster 2007 Annual Report Download - page 22
Download and view the complete annual report
Please find page 22 of the 2007 Red Lobster annual report below. You can navigate through the pages in the report by either clicking on the pages listed below, or by using the keyword search tool below to find specific information within the annual report.-
 1
1 -
2
-
3
-
4
-
5
-
6
-
7
-
8
-
9
-
10
-
11
-
 12
12 -
 13
13 -
 14
14 -
 15
15 -
 16
16 -
 17
17 -
 18
18 -
 19
19 -
 20
20 -
 21
21 -
 22
22 -
 23
23 -
 24
24 -
 25
25 -
 26
26 -
 27
27 -
 28
28 -
 29
29 -
 30
30 -
 31
31 -
 32
32 -
33
-
34
-
35
-
36
-
37
-
38
-
39
-
40
-
41
-
42
-
43
-
44
-
45
-
46
-
47
-
48
-
49
-
50
-
51
-
52
-
53
-
54
-
55
-
56
-
57
-
58
-
59
-
60
-
61
-
62
-
63
-
64
 |
 |

20 Darden Restaurants, Inc. Annual Report 2007
Management’s Discussion and Analysis of Financial Condition and
Results of Operations
M
Sales
Sales from continuing operations were $5.57 billion in fiscal 2007,
$5.35 billion in fiscal 2006 and $4.98 billion in fiscal 2005. The 4.0
percent increase in sales from continuing operations for fiscal 2007
was primarily due to a net increase of 32 company-owned restaurants,
on a continuing operations basis, compared with fiscal 2006 and U.S.
same-restaurant sales increases at Olive Garden, Red Lobster and
Bahama Breeze.
Olive Garden sales of $2.79 billion in fiscal 2007 were 6.6 percent
above last year. Olive Garden opened 32 net new restaurants during
fiscal 2007. U.S. same-restaurant sales for Olive Garden increased
2.7 percent due to a 0.7 percent increase in same-restaurant guest
counts and a 2.0 percent increase in average guest check. Average
annual sales per restaurant for Olive Garden were $4.7 million in fiscal
2007. Olive Garden reported its 51st consecutive quarter of U.S. same-
restaurant sales growth at the end of fiscal 2007.
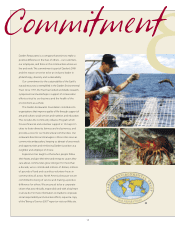
Red Lobster sales of $2.60 billion in fiscal 2007 were 0.9 percent
above last year. U.S. same-restaurant sales for Red Lobster increased
0.2 percent due to a 2.7 percent increase in average guest check and
a 2.5 percent decrease in guest counts. Average annual sales per
restaurant for Red Lobster were $3.8 million in fiscal 2007.
Bahama Breeze sales from continuing operations of $137.9 million
in fiscal 2007 were 0.9 percent above last year. Same-restaurant sales for
Bahama Breeze increased 0.9 percent for fiscal 2007. Average annual
sales per restaurant for Bahama Breeze were $6.0 million in fiscal 2007.
The 7.6 percent increase in company-wide sales for fiscal 2006
versus fiscal 2005 was primarily due to a net increase of 24 company-
owned restaurants, on a continuing operations basis, compared with
fiscal 2005 and U.S. same-restaurant sales increases at Olive Garden
and Red Lobster. Olive Garden’s fiscal 2006 sales of $2.62 billion were
9.0 percent above fiscal 2005. U.S. same-restaurant sales for Olive
Garden increased 5.5 percent in fiscal 2006 due to a 3.4 percent
increase in same-restaurant guest counts and a 2.1 percent increase
in average guest check. Average annual sales per restaurant for Olive
Garden were $4.6 million in fiscal 2006. Red Lobster’s sales of $2.58 bil-
lion in fiscal 2006 were 5.9 percent above fiscal 2005 sales. In fiscal
2006, its U.S. same-restaurant sales increased 4.9 percent due to a 2.0
percent increase in same-restaurant guest counts and a 2.9 percent
increase in average check. Average annual sales per restaurant for
Red Lobster were $3.8 million in fiscal 2006. Bahama Breeze fiscal
2006 sales from continuing operations of $136.6 million increased 3.0
percent from fiscal 2005. On a continuing operations basis, Bahama
Breeze same-restaurant sales increased 3.2 percent in fiscal 2006 and
average annual sales per restaurant for Bahama Breeze in fiscal 2006
were $5.9 million.
Costs and Expenses
Total costs and expenses from continuing operations were
$5.04 billion in fiscal 2007, $4.85 billion in fiscal 2006 and $4.54 billion in
fiscal 2005. Total costs and expenses from continuing operations
in fiscal 2007 and 2006 were 90.5 percent of sales, a decrease from
91.1 percent of sales in fiscal 2005.
Food and beverage costs increased $46.1 million, or 2.9 percent,
from $1.57 billion in fiscal 2006 to $1.62 billion in fiscal 2007. Food
and beverage costs increased $79.7 million, or 5.3 percent, from
$1.49 billion in fiscal 2005 to $1.57 billion in fiscal 2006. As a percent
of sales, food and beverage costs decreased from fiscal 2006 to fiscal
2007 primarily as a result of favorable pricing partially offset by menu
mix changes. Food and beverage costs, as a percent of sales, also
decreased as a result of the larger contribution from Olive Garden,
which has historically had lower food and beverage costs, to our
overall sales and operating results. As a percent of sales, food and
beverage costs decreased from fiscal 2005 to fiscal 2006 primarily as
a result of cost savings initiatives.
Restaurant labor increased $86.1 million, or 5.0 percent, from
$1.72 billion in fiscal 2006 to $1.81 billion in fiscal 2007. Restaurant
labor increased $127.9 million, or 8.0 percent, from $1.59 billion in
fiscal 2005 to $1.72 billion in fiscal 2006. As a percent of sales, restau-
rant labor increased in fiscal 2007 primarily as a result of an increase
in wage rates and an increase in FICA taxes on higher reported tips,
which was partially offset by the favorable impact of higher sales
volumes. The increase in FICA tax expense on higher reported tips is
fully offset at the consolidated net earnings from continuing opera-
tions level by a corresponding income tax credit, which reduces
income tax expense. As a percent of sales, restaurant labor also
increased as a result of the larger contribution by Olive Garden to our
overall sales and operating results, as Olive Garden has historically
had higher restaurant labor costs. As a percent of sales, restaurant
labor increased in fiscal 2006 from fiscal 2005 primarily as a result of
an increase in wage rates and benefit costs and an increase in FICA
taxes on higher reported tips, which was only partially offset by the
favorable impact of higher sales volumes.
Restaurant expenses (which include lease, property tax, credit
card, utility, workers’ compensation, insurance, new restaurant pre-
opening and other restaurant-level operating expenses) increased
$28.1 million, or 3.5 percent, from $806.4 million in fiscal 2006 to $834.5
million in fiscal 2007. Restaurant expenses increased $63.6 million, or
8.6 percent, from $742.8 million in fiscal 2005 to $806.4 million in fiscal
2006. As a percent of sales, restaurant expenses decreased in fiscal
2007 as compared with fiscal 2006 as a result of the favorable impact
of higher sales volumes and decreases in our insurance and workers’
compensation expenses. As a percent of sales, restaurant expenses
increased in fiscal 2006 compared with fiscal 2005 primarily as a result
of higher utility expenses, repair and maintenance expenses and
credit card fees, which were partially offset by the favorable impact
of higher sales volumes and decreases in our insurance and workers’
compensation expenses.