Red Lobster 2007 Annual Report Download - page 28
Download and view the complete annual report
Please find page 28 of the 2007 Red Lobster annual report below. You can navigate through the pages in the report by either clicking on the pages listed below, or by using the keyword search tool below to find specific information within the annual report.-
 1
1 -
2
-
3
-
4
-
5
-
6
-
7
-
8
-
9
-
10
-
11
-
12
-
13
-
14
-
15
-
16
-
17
-
 18
18 -
 19
19 -
 20
20 -
 21
21 -
 22
22 -
 23
23 -
 24
24 -
 25
25 -
 26
26 -
 27
27 -
 28
28 -
 29
29 -
 30
30 -
 31
31 -
 32
32 -
 33
33 -
 34
34 -
 35
35 -
 36
36 -
 37
37 -
 38
38 -
39
-
40
-
41
-
42
-
43
-
44
-
45
-
46
-
47
-
48
-
49
-
50
-
51
-
52
-
53
-
54
-
55
-
56
-
57
-
58
-
59
-
60
-
61
-
62
-
63
-
64
 |
 |

26 Darden Restaurants, Inc. Annual Report 2007
Management’s Discussion and Analysis of Financial Condition and
Results of Operations
M
Our fixed-charge coverage ratio, which measures the number
of times each year that we earn enough to cover our fixed charges,
amounted to 8.6 times and 7.9 times, on a continuing operations
basis, for the fiscal years ended May 27, 2007 and May 28, 2006,
respectively. Our adjusted debt to adjusted total capital ratio (which
includes 6.25 times the total annual restaurant minimum rent
($64.3 million and $67.1 million for the fiscal years ended May 27,
2007 and May 28, 2006, respectively) and 3.00 times the total annual
restaurant equipment minimum rent ($0.0 million for the fiscal years
ended May 27, 2007 and May 28, 2006, respectively) as components
of adjusted debt and adjusted total capital) was 50 percent and 47
percent at May 27, 2007 and May 28, 2006, respectively. We use the
lease-debt equivalent in our adjusted debt to adjusted total capital
ratio reported to shareholders, as we believe its inclusion better
represents the optimal capital structure that we target from period
to period.
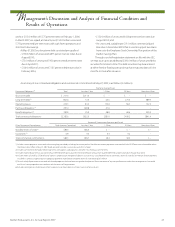
Based on these ratios, we believe our financial condition is
strong. The composition of our capital structure is shown in the
following table.
(In millions, except ratios) May 27, 2007 May 28, 2006
Capital Structure
Short-term debt $ 211.4 $ 44.0
Current portion of long-term debt – 149.9
Long-term debt 491.6 494.7
Stockholders’ equity 1,094.5 1,229.8
Total capital $1,797.5 $1,918.4
Adjustments to Capital
Short-term debt $ 211.4 $ 44.0
Current portion of long-term debt – 149.9
Long-term debt 491.6 494.7
Lease-debt equivalent 397.0 415.0
Adjusted debt $1,100.0 $ 1,103.6
Stockholders’ equity 1,094.5 1,229.8
Adjusted total capital $2,194.5 $2,333.4
Capital Structure Ratios
Debt to total capital ratio 39% 36%
Adjusted debt to adjusted
total capital ratio 50% 47%
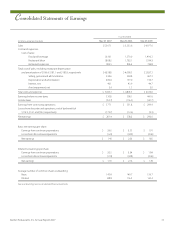
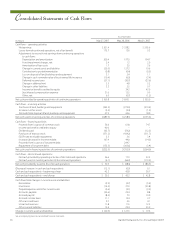
Net cash flows provided by operating activities from continuing
operations were $569.8 million, $699.1 million and $550.0 million in
fiscal 2007, 2006 and 2005, respectively. Net cash flows provided by
operating activities include net earnings from continuing operations
of $377.1 million, $351.8 million and $299.9 million in fiscal 2007, 2006
and 2005, respectively. Net cash flows provided by operating activities
from continuing operations decreased in fiscal 2007 primarily as a
result of the timing of purchases of inventories and restaurant level
services and the reclassification of excess income tax benefits from
the exercise of employee stock options from an operating activity to a
financing activity as required following the adoption of SFAS No. 123(R).
Net cash flows provided by operating activities also reflect income tax
payments of $75.9 million, $126.3 million and $111.4 million in fiscal
2007, 2006 and 2005, respectively.
The decrease in tax payments from fiscal 2006 to fiscal 2007
primarily relates to a decrease in taxable income caused by the closing
of the 54 Smokey Bones, two Rocky River Grillhouse and nine Bahama
Breeze restaurants in fiscal 2007. The increase in tax payments in
fiscal 2006 resulted primarily from accelerated deductions allowable
for depreciation of certain capital expenditures in fiscal 2005, which
lowered our income tax payments in fiscal 2005. In fiscal 2006,
however, the impact of the reduction in accelerated depreciation
deductions was partially offset by increases in income tax benefits
associated with the exercise of employee stock options.
Net cash flows used in investing activities from continuing opera-
tions were $289.5 million, $258.3 million and $193.6 million in fiscal
2007, 2006 and 2005, respectively. Net cash flows used in investing
activities included capital expenditures incurred principally to build
new restaurants, replace equipment and remodel existing restaurants.
Capital expenditures related to continuing operations were $345.2 mil-
lion in fiscal 2007, compared with $273.5 million in fiscal 2006 and
$210.4 million in fiscal 2005. The increased expenditures in fiscal 2007
resulted primarily from increased spending associated with building
more new restaurants and more remodels. We estimate that our fiscal
2008 capital expenditures will approximate $350 million.
Net cash flows used in financing activities from continuing
operations were $322.9 million, $392.9 million and $264.0 million
in fiscal 2007, 2006 and 2005, respectively. Net cash flows used in
financing activities included our repurchase of 9.4 million shares of
our common stock for $371.2 million in fiscal 2007 compared with
11.9 million shares for $434.2 million in fiscal 2006 and 11.3 million
shares for $311.7 million in fiscal 2005. As of May 27, 2007, our Board of
Directors had authorized us to repurchase up to 162.4 million shares
of our common stock and a total of 141.9 million shares had been
repurchased under the authorization. The repurchased common
stock is reflected as a reduction of stockholders’ equity. As of May 27,
2007, our unused authorization was 20.5 million shares. During fiscal
2006 we completed the offering of $300.0 million in senior notes,
resulting in net proceeds of $295.4 million, which were used to repay,
at maturity, $300.0 million in notes outstanding. We also received
proceeds primarily from the issuance of common stock upon the
exercise of stock options of $56.7 million, $61.8 million and $74.7 mil-
lion in fiscal 2007, 2006 and 2005, respectively. Net cash flows used in
financing activities also included dividends paid to stockholders of
$65.7 million, $59.2 million and $12.5 million in fiscal 2007, 2006 and
2005, respectively. The increase in dividend payments reflects the
increase in our annual dividend rate from $0.08 per share in fiscal 2005,
to $0.40 per share in fiscal 2006 and to $0.46 per share in fiscal 2007.