Red Lobster 2007 Annual Report Download - page 61
Download and view the complete annual report
Please find page 61 of the 2007 Red Lobster annual report below. You can navigate through the pages in the report by either clicking on the pages listed below, or by using the keyword search tool below to find specific information within the annual report.-
 1
1 -
2
-
3
-
4
-
5
-
6
-
7
-
8
-
9
-
10
-
11
-
12
-
13
-
14
-
15
-
16
-
17
-
18
-
19
-
20
-
21
-
22
-
23
-
24
-
25
-
26
-
27
-
28
-
29
-
30
-
31
-
32
-
33
-
34
-
35
-
36
-
37
-
38
-
39
-
40
-
41
-
42
-
43
-
44
-
45
-
46
-
47
-
48
-
49
-
50
-
 51
51 -
 52
52 -
 53
53 -
 54
54 -
 55
55 -
 56
56 -
 57
57 -
 58
58 -
 59
59 -
 60
60 -
 61
61 -
 62
62 -
 63
63 -
 64
64
 |
 |

N
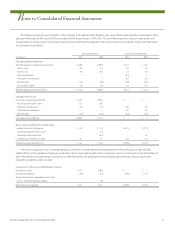
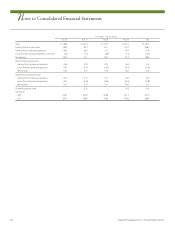
Darden Restaurants, Inc. Annual Report 2007 59
Fiscal Year Ended
May 27, May 28, May 29, May 30, May 25,
(In millions, except per share data) 2007 2006 2005 2004
(2)
2003
Operating Results
(1)
Sales $ 5,567.1 $ 5,353.6 $ 4,977.6 $ 4,794.7 $ 4,530.4
Costs and expenses:
Cost of sales:
Food and beverage 1,616.1 1,570.0 1,490.3 1,456.9 1,407.7
Restaurant labor 1,808.2 1,722.1 1,594.2 1,528.6 1,440.9
Restaurant expenses 834.5 806.4 742.8 728.4 684.3
Total cost of sales, excluding restaurant
depreciation and amortization
(3)
$ 4,258.8 $ 4,098.5 $ 3,827.3 $ 3,713.9 $ 3,532.9
Selling, general and administrative 534.6 504.8 467.3 452.2 418.5
Depreciation and amortization 200.4 197.0 194.7 196.9 182.9
Interest, net 40.1 43.9 44.7 44.9 43.9
Asset impairment and restructuring charges, net 2.4 1.3 2.0 28.1 3.9
Total costs and expenses $ 5,036.3 $ 4,845.5 $ 4,536.0 $ 4,436.0 $ 4,182.1
Earnings before income taxes 530.8 508.1 441.6 358.7 348.3
Income taxes (153.7) (156.3) (141.7) (116.2) (116.1)
Earnings from continuing operations $ 377.1 $ 351.8 $ 299.9 $ 242.5 $ 232.2
Losses from discontinued operations, net of tax benefit of
$112.9, $12.1, $8.3, $10.6 and $4.4 (175.7) (13.6) (9.3) (15.3) (6.2)
Net earnings $ 201.4 $ 338.2 $ 290.6 $ 227.2 $ 226.0
Basic net earnings per share:
Earnings from continuing operations $ 2.63 $ 2.35 $ 1.91 $ 1.48 $ 1.36
Losses from discontinued operations $ (1.23) $ (0.09) $ (0.06) $ (0.09) $ (0.03)
Net earnings $ 1.40 $ 2.26 $ 1.85 $ 1.39 $ 1.33
Diluted net earnings per share:
Earnings from continuing operations $ 2.53 $ 2.24 $ 1.84 $ 1.43 $ 1.31
Losses from discontinued operations $ (1.18) $ (0.08) $ (0.06) $ (0.09) $ (0.04)
Net earnings $ 1.35 $ 2.16 $ 1.78 $ 1.34 $ 1.27
Average number of common shares outstanding:
Basic 143.4 149.7 156.7 163.5 170.3
Diluted 148.8 156.9 163.4 169.7 177.4
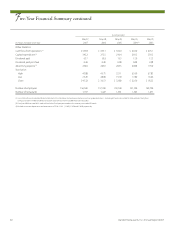
Financial Position
Total assets $ 2,880.8 $ 3,010.2 $ 2,937.8 $ 2,780.3 $ 2,664.6
Land, buildings and equipment, net 2,184.4 2,446.0 2,351.5 2,250.6 2,157.1
Working capital (deficit) (529.0) (648.5) (637.3) (337.2) (314.3)
Long-term debt, less current portion 491.6 494.7 350.3 653.3 658.1
Stockholders’ equity 1,094.5 1,229.8 1,273.0 1,175.3 1,130.1
Stockholders’ equity per outstanding shares 7.74 8.37 8.25 7.42 6.85
Five-Year Financial Summary
Financial Review 2007