Red Lobster 2007 Annual Report Download - page 51
Download and view the complete annual report
Please find page 51 of the 2007 Red Lobster annual report below. You can navigate through the pages in the report by either clicking on the pages listed below, or by using the keyword search tool below to find specific information within the annual report.-
 1
1 -
2
-
3
-
4
-
5
-
6
-
7
-
8
-
9
-
10
-
11
-
12
-
13
-
14
-
15
-
16
-
17
-
18
-
19
-
20
-
21
-
22
-
23
-
24
-
25
-
26
-
27
-
28
-
29
-
30
-
31
-
32
-
33
-
34
-
35
-
36
-
37
-
38
-
39
-
40
-
 41
41 -
 42
42 -
 43
43 -
 44
44 -
 45
45 -
 46
46 -
 47
47 -
 48
48 -
 49
49 -
 50
50 -
 51
51 -
 52
52 -
 53
53 -
 54
54 -
 55
55 -
 56
56 -
 57
57 -
 58
58 -
 59
59 -
 60
60 -
 61
61 -
62
-
63
-
64
 |
 |

N
Darden Restaurants, Inc. Annual Report 2007 49
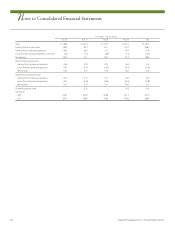
Notes to Consolidated Financial Statements
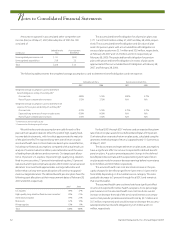
The components of earnings before income taxes from continuing
operations and the provision for income taxes thereon are as follows:
Fiscal Year
(in millions) 2007 2006 2005
Earnings from continuing operations
before income taxes:
U.S. $524.9 $500.6 $434.6
Canada 5.9 7.5 7.0
Earnings from continuing operations
before income taxes $530.8 $508.1 $441.6
Income taxes:
Current:
Federal $172.9 $158.9 $151.8
State and local 33.2 28.1 22.3
Canada 0.1 0.1 0.1
Total current $206.2 $187.1 $174.2
Deferred (principally U.S.) (52.5) (30.8) (32.5)
Total income taxes $153.7 $156.3 $141.7
During fiscal 2007, 2006 and 2005, we paid income taxes of
$75.9 million, $126.3 million and $111.4 million, respectively.
The following table is a reconciliation of the U.S. statutory
income tax rate to the effective income tax rate from continuing
operations included in the accompanying consolidated statements
of earnings:
Fiscal Year
2007 2006 2005
U.S. statutory rate 35.0% 35.0% 35.0%
State and local income taxes,
net of federal tax benefits 3.3 3.1 2.9
Benefit of federal income tax credits (6.1) (5.1) (4.5)
Other, net (3.2) (2.2) (1.3)
Effective income tax rate 29.0% 30.8% 32.1%
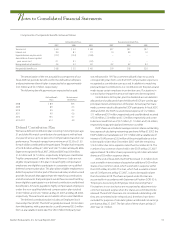
The tax effects of temporary differences that give rise to
deferred tax assets and liabilities are as follows:
(in millions) May 27, 2007 May 28, 2006
Accrued liabilities $ 18.1 $ 17.0
Compensation and employee benefits 118.6 91.5
Deferred rent and interest income 31.8 35.7
Asset disposition 0.6 0.7
Other 6.1 6.2
Gross deferred tax assets $ 175.2 $ 151.1
Buildings and equipment (99.0) (134.3)
Prepaid pension costs (4.7) (22.1)
Prepaid interest (1.1) (1.1)
Capitalized software and other assets (10.1) (10.6)
Other (4.4) (4.0)
Gross deferred tax liabilities $(119.3) $(172.1)
Net deferred tax assets (liabilities) $ 55.9 $ (21.0)
A valuation allowance for deferred tax assets is provided when it
is more likely than not that some portion or all of the deferred tax
assets will not be realized. Realization is dependent upon the genera-
tion of future taxable income or the reversal of deferred tax liabilities
during the periods in which those temporary differences become
deductible. We consider the scheduled reversal of deferred tax liabili-
ties, projected future taxable income and tax planning strategies in
making this assessment. At May 27, 2007 and May 28, 2006, no valua-
tion allowance has been recognized for deferred tax assets because
we believe that sufficient projected future taxable income will be
generated to fully utilize the benefits of these deductible amounts.
Note13
Note14
Note15