Red Lobster 2007 Annual Report Download - page 43
Download and view the complete annual report
Please find page 43 of the 2007 Red Lobster annual report below. You can navigate through the pages in the report by either clicking on the pages listed below, or by using the keyword search tool below to find specific information within the annual report.-
 1
1 -
2
-
3
-
4
-
5
-
6
-
7
-
8
-
9
-
10
-
11
-
12
-
13
-
14
-
15
-
16
-
17
-
18
-
19
-
20
-
21
-
22
-
23
-
24
-
25
-
26
-
27
-
28
-
29
-
30
-
31
-
32
-
 33
33 -
 34
34 -
 35
35 -
 36
36 -
 37
37 -
 38
38 -
 39
39 -
 40
40 -
 41
41 -
 42
42 -
 43
43 -
 44
44 -
 45
45 -
 46
46 -
 47
47 -
 48
48 -
 49
49 -
 50
50 -
 51
51 -
 52
52 -
 53
53 -
54
-
55
-
56
-
57
-
58
-
59
-
60
-
61
-
62
-
63
-
64
 |
 |

N
Darden Restaurants, Inc. Annual Report 2007 41
Notes to Consolidated Financial Statements
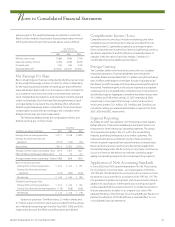
previous grants. The weighted-average assumptions used in the
Black-Scholes model to record stock-based compensation in fiscal
2007 and to derive the pro forma results above, were as follows:
Stock Options
Granted in Fiscal Year
2007 2006 2005
Risk-free interest rate 5.08% 3.91% 3.75%
Expected volatility of stock 34.5% 30.0% 30.0%
Dividend yield 1.3% 1.2% 0.3%
Expected option life 6.4 years 6.0 years 6.0 years
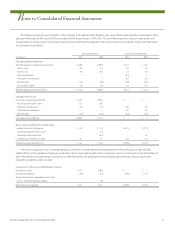
Net Earnings Per Share
Basic net earnings per share are computed by dividing net earnings
by the weighted-average number of common shares outstanding
for the reporting period. Diluted net earnings per share reflect the
potential dilution that could occur if securities or other contracts to
issue common stock were exercised or converted into common
stock. Outstanding stock options, restricted stock, benefits granted
under our Employee Stock Purchase Plan and performance stock
units granted by us represent the only dilutive effect reflected in
diluted weighted-average shares outstanding. These stock-based
compensation instruments do not impact the numerator of the
diluted net earnings per share computation.
The following table presents the computation of basic and
diluted earnings per common share:
Fiscal Year
(in millions, except per share data) 2007 2006 2005
Earnings from continuing operations $ 377.1 $ 351.8 $ 299.9
Earnings (loss) from discontinued
operations (175.7) (13.6) (9.3)
Net earnings $ 201.4 $ 338.2 $ 290.6
Average common shares outstanding – Basic 143.4 149.7 156.7
Effect of dilutive stock-based compensation 5.4 7.2 6.7
Average common shares outstanding – Diluted 148.8 156.9 163.4
Basic net earnings per share:
Earnings from continuing operations $ 2.63 $ 2.35 $ 1.91
Earnings (loss) from discontinued
operations (1.23) (0.09) (0.06)
Net earnings $ 1.40 $ 2.26 $ 1.85
Diluted net earnings per share:
Earnings from continuing operations $ 2.53 $ 2.24 $ 1.84
Earnings (loss) from discontinued operations (1.18) (0.08) (0.06)
Net earnings $ 1.35 $ 2.16 $ 1.78
Options to purchase 1.8 million shares, 0.1 million shares and
2.7 million shares of common stock were excluded from the calcula-
tion of diluted net earnings per share for fiscal 2007, 2006 and 2005,
respectively, because the effect would have been anti-dilutive.
Comprehensive Income (Loss)
Comprehensive income (loss) includes net earnings and other
comprehensive income (loss) items that are excluded from net
earnings under U.S. generally accepted accounting principles.
Other comprehensive income (loss) items include foreign currency
translation adjustments and the effective unrealized portion of
changes in the fair value of cash flow hedges. See Note 12 –
Stockholders’ Equity for additional information.
Foreign Currency
The Canadian dollar is the functional currency for our Canadian
restaurant operations. Assets and liabilities denominated in
Canadian dollars are translated into U.S. dollars using the exchange
rates in effect at the balance sheet date. Results of operations are
translated using the average exchange rates prevailing throughout
the period. Translation gains and losses are reported as a separate
component of accumulated other comprehensive income (loss) in
stockholders’ equity. Aggregate cumulative translation losses were
$4.3 million and $4.8 million at May 27, 2007 and May 28, 2006,
respectively. Losses (gains) from foreign currency transactions,
which amounted to $0.1 million, ($0.1) million and $0 million, are
included in selling, general and administrative expenses for fiscal
2007, 2006 and 2005, respectively.
Segment Reporting
As of May 27, 2007, we operated 1,397 Red Lobster, Olive Garden,
Bahama Breeze, Smokey Bones Barbeque & Grill and Seasons 52
restaurants in North America as operating segments. The restau-
rants operate principally in the U.S. within the casual dining
industry, providing similar products to similar customers. The
restaurants also possess similar pricing structures, resulting in
similar long-term expected financial performance characteristics.
Revenues from external customers are derived principally from
food and beverage sales. We do not rely on any major customers as
a source of revenue. We believe we meet the criteria for aggre-
gating our operating segments into a single reporting segment.
Application of New Accounting Standards
In June 2006, the FASB issued Interpretation No. 48, “Accounting
for Uncertainty in Income Taxes – an interpretation of SFAS No.
109” (FIN 48). FIN 48 clarifies the accounting for uncertain income
tax positions accounted for in accordance with SFAS No. 109. The
Interpretation stipulates recognition and measurement criteria in
addition to classification, interim period accounting and signifi-
cantly expanded disclosure provisions for uncertain tax positions
that are expected to be taken in a company’s tax return. We
adopted FIN 48 as of the first day of our fiscal 2008 year. We do not
believe the adoption of FIN 48 will have a material effect on our
consolidated financial statements.