Red Lobster 2007 Annual Report Download - page 54
Download and view the complete annual report
Please find page 54 of the 2007 Red Lobster annual report below. You can navigate through the pages in the report by either clicking on the pages listed below, or by using the keyword search tool below to find specific information within the annual report.-
 1
1 -
2
-
3
-
4
-
5
-
6
-
7
-
8
-
9
-
10
-
11
-
12
-
13
-
14
-
15
-
16
-
17
-
18
-
19
-
20
-
21
-
22
-
23
-
24
-
25
-
26
-
27
-
28
-
29
-
30
-
31
-
32
-
33
-
34
-
35
-
36
-
37
-
38
-
39
-
40
-
41
-
42
-
43
-
 44
44 -
 45
45 -
 46
46 -
 47
47 -
 48
48 -
 49
49 -
 50
50 -
 51
51 -
 52
52 -
 53
53 -
 54
54 -
 55
55 -
 56
56 -
 57
57 -
 58
58 -
 59
59 -
 60
60 -
 61
61 -
 62
62 -
 63
63 -
 64
64
 |
 |

52 Darden Restaurants, Inc. Annual Report 2007
Notes to Consolidated Financial Statements
N
Amounts recognized in accumulated other comprehensive
income (loss) as of May 27, 2007, after adoption of SFAS No. 158
consisted of:
Defined Benefit Postretirement
(in millions) Plan Benefit Plan
Unrecognized prior service cost $ 0.1 $(0.2)
Unrecognized actuarial loss 21.9 3.5
Total $22.0 $ 3.3
The accumulated benefit obligation for all pension plans was
$171.1 and $160.8 million at May 27, 2007 and May 28, 2006, respec-
tively. The accumulated benefit obligation and fair value of plan
assets for pension plans with accumulated benefit obligations in
excess of plan assets were $5.1 million and $0.0 million, respectively,
at February 28, 2007 and $5.2 million and $0.0, respectively, at
February 28, 2006. The projected benefit obligation for pension
plans with projected benefit obligations in excess of plan assets
approximated their accumulated benefit obligation at February 28,
2007 and February 28, 2006.
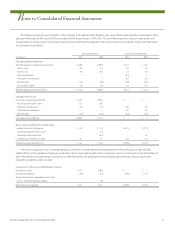
The following table presents the weighted-average assumptions used to determine benefit obligations and net expense:
Defined Benefit Plans Postretirement Benefit Plan
2007 2006 2007 2006
Weighted-average assumptions used to determine
benefit obligations at May 27 and May 28, (1)
Discount rate 5.80% 5.75% 5.80% 5.75%
Rate of future compensation increases 3.75% 3.75% N/A N/A
Weighted-average assumptions used to determine net
expense for fiscal years ended May 27 and May 28,(2)
Discount rate 5.75% 5.75% 5.75% 5.75%
Expected long-term rate of return on plan assets 9.00% 9.00% N/A N/A
Rate of future compensation increases 3.75% 3.75% N/A N/A
(1)
Determined as of the end of fiscal year
(2)
Determined as of the beginning of fiscal year
We set the discount rate assumption annually for each of the
plans at their valuation dates to reflect the yield of high-quality fixed-
income debt instruments, with lives that approximate the maturity
of the plan benefits. The expected long-term rate of return on plan
assets and health care cost trend rates are based upon several factors,
including our historical assumptions compared with actual results, an
analysis of current market conditions, asset allocations and the views
of leading financial advisers and economists. Our target asset alloca-
tion is 35 percent U.S. equities, 30 percent high-quality, long-duration
fixed-income securities, 15 percent international equities, 10 percent
real assets and 10 percent private equities. We monitor our actual asset
allocation to ensure that it approximates our target allocation and
believe that our long-term asset allocation will continue to approxi-
mate our target allocation. The defined benefit pension plans have the
following asset allocations at their measurement dates of February 28,
2007 and 2006, respectively:
2007 2006
U.S. equities 39% 37%
High-quality, long-duration fixed-income securities 20% 21%
International equities 19% 21%
Real assets 12% 12%
Private equities 10% 9%
Total 100% 100%
For fiscal 2005 through 2007 we have used an expected long-term
rate of return on plan assets for our defined benefit plan of 9.0 percent.
Our historical ten-year rate of return on plan assets, calculated using the
geometric method average of returns, is approximately 11.0 percent as
of May 27, 2007.
The discount rate and expected return on plan assets assumptions
have a significant effect on amounts reported for defined benefit
pension plans. A quarter percentage point change in the defined
benefit plans’ discount rate and the expected long-term rate of return
on plan assets would increase or decrease earnings before income taxes
by $0.6 million and $0.4 million, respectively.
The assumed health care cost trend rate increase in the per-
capita charges for benefits ranged from 9 percent to 10 percent for
fiscal 2008, depending on the medical service category. The rates
gradually decrease to 5 percent through fiscal 2012 and remain at
that level thereafter.
The assumed health care cost trend rate has a significant effect
on amounts reported for retiree health care plans. A one percentage
point variance in the assumed health care cost trend rate would
increase or decrease the total of the service and interest cost compo-
nents of net periodic postretirement benefit cost by $0.7 million and
$0.5 million, respectively, and would increase or decrease the accumu-
lated postretirement benefit obligation by $4.5 million and $3.0
million, respectively.