Red Lobster 2004 Annual Report Download - page 55
Download and view the complete annual report
Please find page 55 of the 2004 Red Lobster annual report below. You can navigate through the pages in the report by either clicking on the pages listed below, or by using the keyword search tool below to find specific information within the annual report.-
 1
1 -
2
-
3
-
4
-
5
-
6
-
7
-
8
-
9
-
10
-
11
-
12
-
13
-
14
-
15
-
16
-
17
-
18
-
19
-
20
-
21
-
22
-
23
-
24
-
25
-
26
-
27
-
28
-
29
-
30
-
31
-
32
-
33
-
34
-
35
-
36
-
37
-
38
-
39
-
40
-
41
-
42
-
43
-
44
-
 45
45 -
 46
46 -
 47
47 -
 48
48 -
 49
49 -
 50
50 -
 51
51 -
 52
52 -
 53
53 -
 54
54 -
 55
55 -
 56
56 -
 57
57 -
 58
58
 |
 |

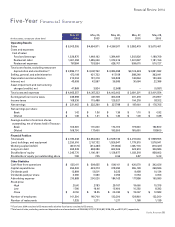
Five-Year
Financial Summary
May30, May25, May26, May27, May28,
(Inthousands,exceptpersharedata)2004(1) 2003 2002 2001 2000
OperatingResults
Sales $5,003,355 $4,654,971 $ 4,366,911 $ 3,992,419 $3,675,461
Costsandexpenses:
Costofsales:
Foodandbeverage 1,526,875 1,449,162 1,384,481 1,302,926 1,199,709
Restaurantlabor 1,601,258 1,485,046 1,373,416 1,261,837 1,181,156
Restaurantexpenses 767,584 703,554 628,701 559,670 510,727
Totalcostofsales,excludingrestaurant
depreciationandamortization(2) $3,895,717 $3,637,762 $3,386,598 $3,124,433 $2,891,592
Selling,general,andadministrative 472,109 431,722 417,158 389,240 363,041
Depreciationandamortization 210,004 191,218 165,829 146,864 130,464
Interest,net 43,659 42,597 36,585 30,664 22,388
Assetimpairmentandrestructuring
charges(credits),net 41,868 3,924 (2,568) – (5,931)
Totalcostsandexpenses $4,663,357 $4,307,223 $4,003,602 $ 3,691,201 $3,401,554
Earningsbeforeincometaxes 339,998 347,748 363,309 301,218 273,907
Incometaxes 108,536 115,488 125,521 104,218 97,202
Netearnings $ 231,462 $ 232,260 $ 237,788 $ 197,000 $ 176,705
Netearningspershare:
Basic $ 1.42 $ 1.36 $ 1.36 $ 1.10 $ 0.92
Diluted $ 1.36 $ 1.31 $ 1.30 $ 1.06 $ 0.89
Averagenumberofcommonshares
outstanding,netofsharesheldinTreasury:
Basic 163,500 170,300 174,700 179,600 192,800
Diluted 169,700 177,400 183,500 185,600 197,800
FinancialPosition
Totalassets $2,780,348 $2,664,633 $2,529,736 $2,216,534 $1,969,555
Land,buildings,andequipment 2,250,616 2,157,132 1,926,947 1,779,515 1,578,541
Workingcapital(deficit) (337,174) (314,280) (157,662) (226,116) (316,427)
Long-termdebt 653,349 658,086 662,506 520,574 306,586
Stockholders’equity 1,245,770 1,196,191 1,128,877 1,033,318 958,602
Stockholders’equityperoutstandingshare 7.86 7.25 6.56 5.87 5.23
OtherStatistics
Cashflowfromoperations $ 525,411 $ 508,635 $ 508,101 $ 420,570 $ 342,626
Capitalexpenditures 354,326 423,273 318,392 355,139 268,946
Dividendspaid 12,984 13,501 9,225 9,458 10,134
Dividendspaidpershare 0.080 0.080 0.053 0.053 0.053
Advertisingexpense 210,989 200,020 184,163 177,998 165,590
Stockprice:
High 25.60 27.83 29.767 19.660 15.375
Low 17.80 16.46 15.400 10.292 8.292
Close $ 22.50 $ 18.35 $ 25.030 $ 19.267 $ 12.583
Numberofemployees 141,300 140,700 133,200 128,900 122,300
Numberofrestaurants 1,325 1,271 1,211 1,168 1,139
(1)Fiscalyear2004consistedof53weekswhileallotherfiscalyearsconsistedof52weeks.
(2)Totalcostofsales,excludingrestaurantdepreciationandamortizationof$195,486,$177,127,$155,837,$138,229,and$123,477,respectively.
55
Financial Review 2004