Red Lobster 2004 Annual Report Download - page 37
Download and view the complete annual report
Please find page 37 of the 2004 Red Lobster annual report below. You can navigate through the pages in the report by either clicking on the pages listed below, or by using the keyword search tool below to find specific information within the annual report.-
 1
1 -
2
-
3
-
4
-
5
-
6
-
7
-
8
-
9
-
10
-
11
-
12
-
13
-
14
-
15
-
16
-
17
-
18
-
19
-
20
-
21
-
22
-
23
-
24
-
25
-
26
-
 27
27 -
 28
28 -
 29
29 -
 30
30 -
 31
31 -
 32
32 -
 33
33 -
 34
34 -
 35
35 -
 36
36 -
 37
37 -
 38
38 -
 39
39 -
 40
40 -
 41
41 -
 42
42 -
 43
43 -
 44
44 -
 45
45 -
 46
46 -
 47
47 -
48
-
49
-
50
-
51
-
52
-
53
-
54
-
55
-
56
-
57
-
58
 |
 |

37
Financial Review 2004
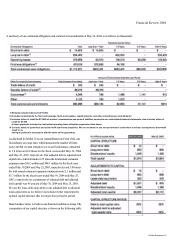
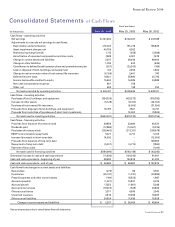
ConsolidatedStatementsof Cash Flows
FiscalYearEnded
(Inthousands)May30,2004 May25,2003 May26,2002
Cashflows–operatingactivities
Netearnings $231,462 $232,260 $237,788
Adjustmentstoreconcilenetearningstocashflows:
Depreciationandamortization 210,004 191,218 165,829
Assetimpairmentcharges,net 40,756 4,282 –
Restructuringcharge(credit) 1,112 (358) (2,568)
Amortizationofunearnedcompensationandloancosts 7,599 6,901 7,578
Changeincurrentassetsandliabilities 2,207 36,046 49,604
Changeinotherliabilities 1,794 420 (496)
Contributiontodefinedbenefitpensionplansandpostretirementplan (257) (20,203) (164)
Lossondisposalofland,buildings,andequipment 104 2,456 1,803
Changeincashsurrendervalueoftrust-ownedlifeinsurance (6,106) 2,441 743
Deferredincometaxes 19,621 35,890 22,743
Incometaxbenefitscreditedtoequity 15,650 16,385 24,989
Non-cashcompensationexpense 861 758 –
Other,net 604 139 252
Netcashprovidedbyoperatingactivities $525,411 $508,635 $508,101
Cashflows–investingactivities
Purchasesofland,buildings,andequipment (354,326) (423,273) (318,392)
Increaseinotherassets (5,128) (8,100) (24,700)
Purchaseoftrust-ownedlifeinsurance – (6,000) (31,500)
Proceedsfromdisposalofland,buildings,andequipment 16,197 7,641 10,741
Proceedsfrommaturitiesof(purchasesof)short-terminvestments – 10,000 (9,904)
Netcashusedininvestingactivities $(343,257) $(419,732) $(373,755)
Cashflows–financingactivities
Proceedsfromissuanceofcommonstock 39,856 33,664 40,520
Dividendspaid (12,984) (13,501) (9,225)
Purchasesoftreasurystock (235,462) (213,311) (208,578)
ESOPnotereceivablerepayments 5,027 4,710 5,315
Increase(decrease)inshort-termdebt 14,500 – (12,000)
Proceedsfromissuanceoflong-termdebt – – 149,655
Repaymentoflong-termdebt (5,027) (4,710) (7,962)
Paymentofloancosts – – (1,010)
Netcashusedinfinancingactivities $(194,090) $(193,148) $(43,285)
(Decrease)increaseincashandcashequivalents (11,936) (104,245) 91,061
Cashandcashequivalents–beginningofyear 48,630 152,875 61,814
Cashandcashequivalents–endofyear $36,694 $48,630 $152,875
Cashflowsfromchangesincurrentassetsandliabilities
Receivables (279) 66 3,781
Inventories (25,137) (1,231) (23,984)
Prepaidexpensesandothercurrentassets (190) (8,523) 1,987
Accountspayable (1,027) 15,927 3,205
Accruedpayroll 17,352 (1,961) 5,348
Accruedincometaxes (19,222) (529) 20,806
Otheraccruedtaxes 3,371 4,595 3,045
Unearnedrevenues 2,815 16,066 18,487
Othercurrentliabilities 24,524 11,636 16,929
Changeincurrentassetsandliabilities $2,207 $36,046 $49,604
Seeaccompanyingnotestoconsolidatedfinancialstatements.