Red Lobster 2004 Annual Report Download - page 3
Download and view the complete annual report
Please find page 3 of the 2004 Red Lobster annual report below. You can navigate through the pages in the report by either clicking on the pages listed below, or by using the keyword search tool below to find specific information within the annual report.-
 1
1 -
 2
2 -
 3
3 -
 4
4 -
 5
5 -
 6
6 -
 7
7 -
 8
8 -
 9
9 -
 10
10 -
 11
11 -
 12
12 -
 13
13 -
 14
14 -
15
-
16
-
17
-
18
-
19
-
20
-
21
-
22
-
23
-
24
-
25
-
26
-
27
-
28
-
29
-
30
-
31
-
32
-
33
-
34
-
35
-
36
-
37
-
38
-
39
-
40
-
41
-
42
-
43
-
44
-
45
-
46
-
47
-
48
-
49
-
50
-
51
-
52
-
53
-
54
-
55
-
56
-
57
-
58
 |
 |

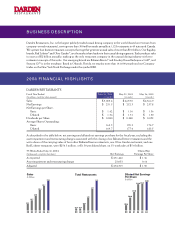
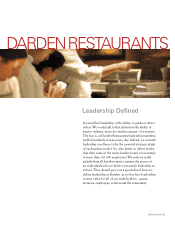
DARDEN RESTAURANTS
Fiscal Year Ended May 30, 2004 May 25, 2003 May 26, 2002
Sales $ 5,003.4 $ 4,655.0 $ 4,366.9
Net Earnings $ 231.5 $ 232.3 $ 237.8
Net Earnings per Share:
Basic $ 1.42 $ 1.36 $ 1.36
Diluted $ 1.36 $ 1.31 $ 1.30
Dividends per Share $ 0.080 $ 0.080 $ 0.053
Average Shares Outstanding:
Basic 163.5 170.3 174.7
Diluted 169.7 177.4 183.5
As described in the table below, net earnings and diluted net earnings per share for the fiscal year, excluding the
asset impairment and restructuring charges associated with the closing of six Bahama Breeze restaurants and the
write-down of the carrying value of four other Bahama Breeze restaurants, one Olive Garden restaurant, and one
Red Lobster restaurant, were $254.5 million, or $1.50 per diluted share, on 53-week sales of $5.0 billion.
53 Weeks Ended May 30, 2004 Diluted Net
Net Earnings Earnings Per Share
As reported $ 231,462 $ 1.36
Asset impairment and restructuring charge 23,053 0.14
Adjusted $ 254,515 $ 1.50
BUSI NES SD ESC RI P TI ON
200 4FINANCIALHIGHLIGHTS
Darden Restaurants, Inc. is the largest publicly traded casual dining company in the world (based on revenues from
company-owned restaurants), serving more than 300 million meals annually at 1,325 restaurants in 49 states and Canada.
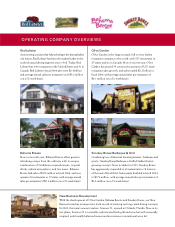
We operate four distinct restaurant concepts that together generate annual sales of more than $5.0 billion. Our flagship
brands, Red Lobster® and Olive Garden®, are the market share leaders in their casual dining segments. Each produces sales
in excess of $2 billion annually, making us the only restaurant company in the causual dining industry with two
restaurant concepts of this scale. Our emerging brands are Bahama Breeze® and Smokey Bones Barbeque & Grill®, and
Seasons 52SM is in the test phase. Based in Orlando, Florida, we employ more than 141,000 people and our Company
trades on the New York Stock Exchange under the symbol DRI.
99
$5.0
$4.5
$4.0
$3.5
$3.0
00 01 02 03 04
Sales
In billions
3.0
3.5
4.0
4.5
5.0
$3.4
$3.7
$4.0
$4.4
$4.7
$5.0
99
1325
1275
1225
1175
1125
00 01 02 03 04
Total Restaurants
1,139 1,139
1,168
1,211
1,271
1,325
99
$1.400
$1.175
$0.950
$0.725
$0.500
00 01 02 03 04
Diluted Net Earnings
Per Share
In dollars
0.500
0.725
0.950
1.175
1.400
$0.66
$0.89
$1.06
$1.30 $1.31
$1.36