Red Lobster 2004 Annual Report Download - page 30
Download and view the complete annual report
Please find page 30 of the 2004 Red Lobster annual report below. You can navigate through the pages in the report by either clicking on the pages listed below, or by using the keyword search tool below to find specific information within the annual report.-
 1
1 -
2
-
3
-
4
-
5
-
6
-
7
-
8
-
9
-
10
-
11
-
12
-
13
-
14
-
15
-
16
-
17
-
18
-
19
-
 20
20 -
 21
21 -
 22
22 -
 23
23 -
 24
24 -
 25
25 -
 26
26 -
 27
27 -
 28
28 -
 29
29 -
 30
30 -
 31
31 -
 32
32 -
 33
33 -
 34
34 -
 35
35 -
 36
36 -
 37
37 -
 38
38 -
 39
39 -
 40
40 -
41
-
42
-
43
-
44
-
45
-
46
-
47
-
48
-
49
-
50
-
51
-
52
-
53
-
54
-
55
-
56
-
57
-
58
 |
 |

Financial Review 2004
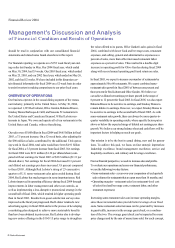
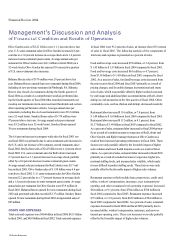
Management's Discussion and Analysis
of Financial Condition and Results of Operations
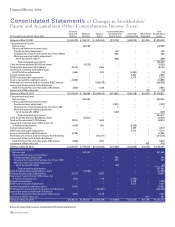
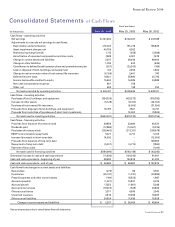
Net cash flows used in financing activities included our repurchase
of 10.7 million shares of our common stock for $235 million in fis-
cal 2004, compared to 10.7 million shares for $213 million in fiscal
2003, and 9.0 million shares for $209 million in fiscal 2002. Our
Board of Directors has authorized us to repurchase up to 115.4 mil-
lion shares of our common stock. At May 30, 2004, a total of
109.2 million shares have been repurchased under the authoriza-
tion. The repurchased common stock is reflected as a reduction of
stockholders' equity. Net cash flows used in financing activities also
included dividends paid to stockholders of $13 million, $14 million,
and $9 million in fiscal 2004, 2003, and 2002, respectively.
Net cash flows used in investing activities included capital expen-
ditures incurred principally for building new restaurants, replacing
equipment, and remodeling existing restaurants. Capital expendi-
tures were $354 million in fiscal 2004, compared to $423 million in
fiscal 2003, and $318 million in fiscal 2002. The decreased expen-
ditures in fiscal 2004 resulted primarily from decreased spending
associated with building fewer new restaurants and fewer remodels.
The increased expenditures in fiscal 2003 resulted primarily from
increased spending associated with building more new restaurants
and replacing equipment. We estimate that our fiscal 2005 capital
expenditures will approximate $360 million.
Net cash flows provided by operating activities for fiscal 2003
included a $20 million contribution to our defined benefit pension
plans, which enabled the plans to maintain a fully funded status
as of the plans' February 28,2003 annual valuation date. Less than
$0.1 million was required to fund our defined benefit pension
plans in fiscal 2004 and fiscal 2002. Our defined benefit and other
postretirement benefit costs and liabilities are calculated using
various actuarial assumptions and methodologies prescribed under
the Financial Accounting Standards Board's (FASB) Statement
of Financial Accounting Standards (SFAS) No. 87, "Employers'
Accounting for Pensions" and No. 106, "Employers' Accounting
for Postretirement Benefits Other Than Pensions". We use certain
assumptions including, but not limited to, the selection of a dis-
count rate, expected long-term rate of return on plan assets, and
expected health care cost trend rates. We set the discount rate
assumption annually for each plan at its valuation date to reflect the
yield of high quality fixed-income debt instruments, with lives that
approximate the maturity of the plan benefits. At May 30, 2004,
our discount rate was 6.0 percent. The expected long-term rate of
return on plan assets and health care cost trend rates are based upon
several factors, including our historical assumptions compared with
actual results, an analysis of current market conditions, asset alloca-
tions, and the views of leading financial advisers and economists.
Based on our analysis during fiscal 2003, we lowered our defined
benefit plans' expected long-term rate of return on plan assets for
fiscal 2004 from 10.4 percent to 9.0 percent. The change in our
defined benefit plans' expected long-term rate of return on plan
assets decreased earnings before income taxes by approximately
$2 million in fiscal 2004. At May 30,2004, our expected health care
cost trend rates ranged from 11.0 percent to 12.0 percent for fiscal
2005, depending on the medical service category. The rates gradu-
ally decrease to 5.0 percent through fiscal 2010 and remain at that
level thereafter.
The expected long-term rate of return on plan assets component
of our net periodic benefit cost is calculated based on the market-
related value of plan assets. Our target asset allocation is 35 percent
U.S. equities, 30 percent high-quality, long-duration fixed-income
securities, 15 percent international equities, 10 percent private
equities, and 10 percent real assets. We monitor our actual asset
allocation to ensure that it approximates our target allocation and
believe that our long-term asset allocation will continue to approxi-
mate our target allocation. Our historical ten-year rate of return
on plan assets, calculated using the geometric method average of
returns, is approximately 10.5 percent as of May 30,2004.
We have an unrecognized net actuarial loss for the defined ben-
efit plans and postretirement benefit plan as of May 30, 2004, of
$62 million and $6 million, respectively. The unrecognized net
actuarial loss represents changes in the amount of the projected
benefit obligation and plan assets resulting from differences in the
assumptions used and actual experience. The amortization of the
unrecognized net actuarial loss component of our fiscal 2005 net
periodic benefit cost for the defined benefit plans and postretire-
ment benefit plan is expected to be approximately $5 million and
$0.3 million, respectively.
We believe our defined benefit and postretirement benefit plan
assumptions are appropriate based upon the factors discussed above.
However, other assumptions could also be reasonably applied that
30 Darden Restaurants