Red Lobster 2004 Annual Report Download - page 31
Download and view the complete annual report
Please find page 31 of the 2004 Red Lobster annual report below. You can navigate through the pages in the report by either clicking on the pages listed below, or by using the keyword search tool below to find specific information within the annual report.-
 1
1 -
2
-
3
-
4
-
5
-
6
-
7
-
8
-
9
-
10
-
11
-
12
-
13
-
14
-
15
-
16
-
17
-
18
-
19
-
20
-
 21
21 -
 22
22 -
 23
23 -
 24
24 -
 25
25 -
 26
26 -
 27
27 -
 28
28 -
 29
29 -
 30
30 -
 31
31 -
 32
32 -
 33
33 -
 34
34 -
 35
35 -
 36
36 -
 37
37 -
 38
38 -
 39
39 -
 40
40 -
 41
41 -
42
-
43
-
44
-
45
-
46
-
47
-
48
-
49
-
50
-
51
-
52
-
53
-
54
-
55
-
56
-
57
-
58
 |
 |

Financial Review 2004
could differ from the assumptions used. A quarter percentage point
change in the defined benefit plans' discount rate and the expected
long-term rate of return on plan assets would increase or decrease
earnings before income taxes by $0.8 million and $0.4 million,
respectively. A quarter percentage point change in our postretire-
ment benefit plan discount rate would increase or decrease earnings
before income taxes by $0.1 million. A one percentage point
increase in the health care cost trend rates would have increased the
accumulated postretirement benefit obligation (APBO) by $4 mil-
lion at May 30, 2004, and the aggregate of the service cost and
interest cost components of net periodic postretirement benefit
cost by $0.3 million for fiscal 2004. A one percentage point decrease
in the health care cost trend rates would have decreased the APBO
by $3 million at May 30, 2004, and the aggregate of the service cost
and interest cost components of net periodic postretirement benefit
cost by $0.3 million for fiscal 2004. These changes in assumptions
would not significantly impact our funding requirements.
We are not aware of any trends or events that would materially
affect our capital requirements or liquidity. We believe that our
internal cash-generating capabilities, borrowings available under
our shelf registration for unsecured debt securities, and short-term
commercial paper program should be sufficient to finance our capi-
tal expenditures, stock repurchase program, and other operating
activities through fiscal 2005.
OFF-BALANCE SHEET ARRANGEMENTS
We are not a party to any off-balance sheet arrangements that have,
or are reasonably likely to have, a current or future material effect
on our financial condition, changes in financial condition, revenues
or expenses, results of operations, liquidity, capital expenditures,
or capital resources.
FINANCIAL CONDITION
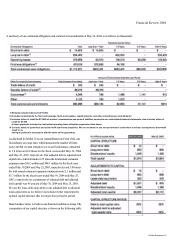
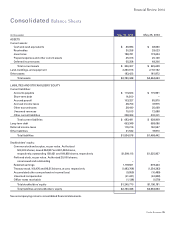
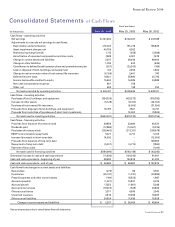
Our current assets totaled $346 million at May 30,2004, compared
to $326 million at May 25, 2003. The increase resulted primarily
from increases in inventories of $25 million that resulted from oppor-
tunistic product purchases made during fiscal 2004.
Our current liabilities were $683 million at May 30,2004, compared
to $640 million at May 25, 2003. At May 30, 2004, $15 million of
short-term debt was outstanding under our commercial paper
program, which was used to fund current operations and capital
expenditures. Accrued payroll of $103 million at May 30, 2004,
increased from $86 million at May 25, 2003, principally due to
higher incentive compensation earned in fiscal 2004. Other cur-
rent liabilities of $228 million at May 30, 2004, increased from
$202 million at May 25, 2003, principally due to a $19 million
increase in liabilities associated with our non-qualified deferred
compensation plan and a $7 million increase in sales tax payable as
a result of higher fourth quarter sales in fiscal 2004. Accrued income
taxes of $49 million at May 30, 2004, decreased from $68 million
at May 25, 2003, principally due to timing of income tax payments
made and changes in temporary differences included in the deferred
tax balances associated with current income tax deductions for
certain land, buildings, and equipment. The $ 19 million decrease
in accrued income taxes is offset by the related increase in net non-
current deferred income tax liabilities at May 30, 2004.
QUANTITATIVE AND QUALITATIVE DISCLOSURES
ABOUT MARKET RISK
We are exposed to a variety of market risks, including fluctuations
in interest rates, foreign currency exchange rates, and commodity
prices. To manage this exposure, we periodically enter into inter-
est rate, foreign currency exchange, and commodity instruments
for other than trading purposes (see Notes 1 and 8 of the Notes to
Consolidated Financial Statements).
We use the variance/covariance method to measure value at risk,
over time horizons ranging from one week to one year, at the
95 percent confidence level. At May 30, 2004, our potential losses
in future net earnings resulting from changes in foreign currency
exchange rate instruments, commodity instruments, and floating
rate debt interest rate exposures were approximately $2 million
over a period of one year (including the impact of the interest rate
swap agreements discussed in Note 8 to the Notes to Consolidated
Financial Statements). The value at risk from an increase in the fair
value of all of our long-term fixed rate debt, over a period of one
year, was approximately $22 million. The fair value of our long-
term fixed rate debt during fiscal 2004 averaged $690 million, with
a high of $714 million and a low of $669 million. Our interest rate
risk management objective is to limit the impact of interest rate
changes on earnings and cash flows by targeting an appropriate
mix of variable and fixed rate debt.
Darden Restaurants 31