Red Lobster 2004 Annual Report Download - page 47
Download and view the complete annual report
Please find page 47 of the 2004 Red Lobster annual report below. You can navigate through the pages in the report by either clicking on the pages listed below, or by using the keyword search tool below to find specific information within the annual report.-
 1
1 -
2
-
3
-
4
-
5
-
6
-
7
-
8
-
9
-
10
-
11
-
12
-
13
-
14
-
15
-
16
-
17
-
18
-
19
-
20
-
21
-
22
-
23
-
24
-
25
-
26
-
27
-
28
-
29
-
30
-
31
-
32
-
33
-
34
-
35
-
36
-
 37
37 -
 38
38 -
 39
39 -
 40
40 -
 41
41 -
 42
42 -
 43
43 -
 44
44 -
 45
45 -
 46
46 -
 47
47 -
 48
48 -
 49
49 -
 50
50 -
 51
51 -
 52
52 -
 53
53 -
 54
54 -
 55
55 -
 56
56 -
 57
57 -
58
 |
 |
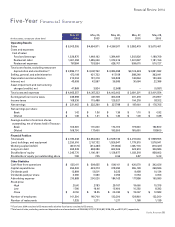
Notesto
Consolidated Financial Statements
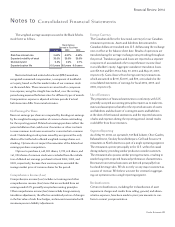
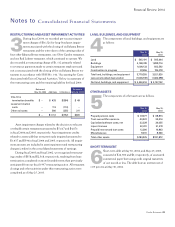
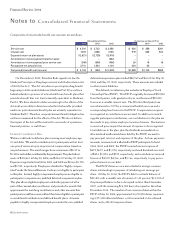
INTEREST,NET
12The components of interest, net, are as follows:
FiscalYear
2004 2003 2002
Interestexpense $47,710 $47,566 $41,493
Capitalizedinterest (3,500) (3,470) (3,653)
Interestincome (551) (1,499) (1,255)
Interest,net $43,659 $42,597 $36,585
Capitalized interest was computed using our average borrowing
rate. We paid $39,661, $38,682, and $31,027, for interest (excluding
amounts capitalized) in fiscal 2004, 2003, and 2002, respectively.
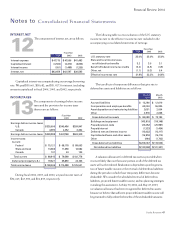
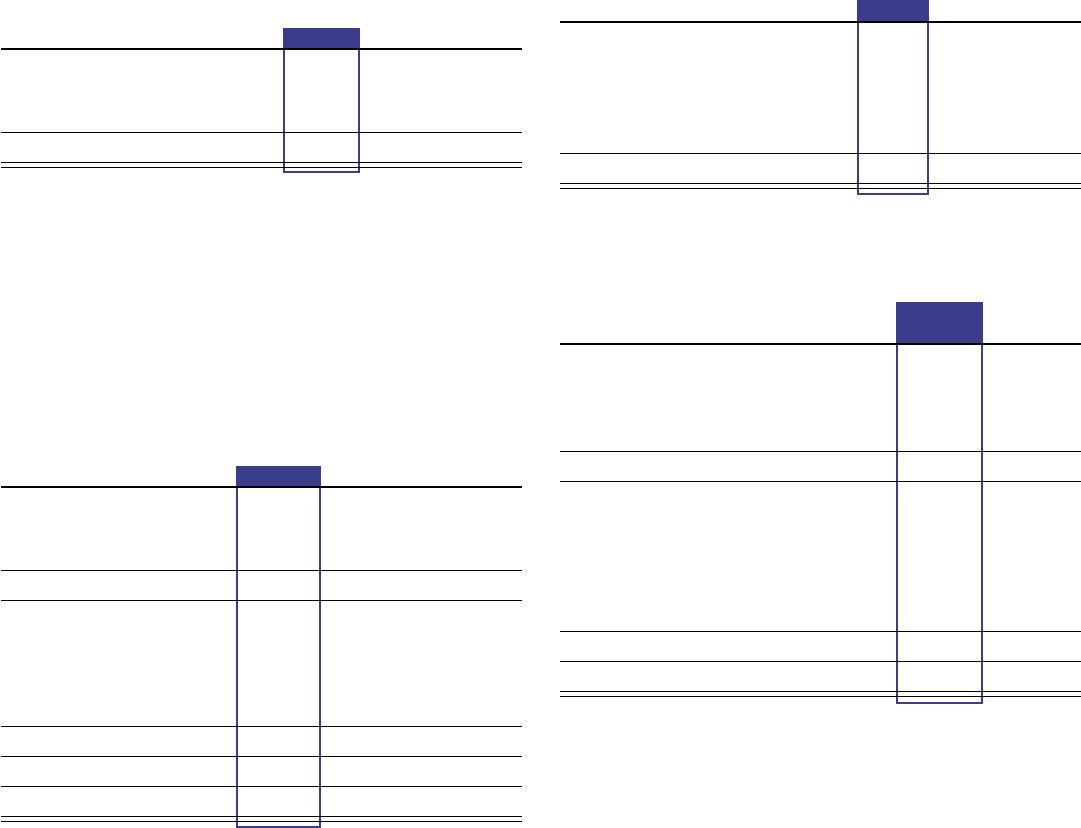
INCOMETAXES
13The components of earnings before income
taxes and the provision for income taxes
thereon are as follows:
FiscalYear
2004 2003 2002
Earningsbeforeincometaxes:
U.S. $335,606 $345,496 $359,947
Canada 4,392 2,252 3,362
Earningsbeforeincometaxes $339,998 $347,748 $363,309
Incometaxes:
Current:
Federal $75,121 $68,178 $88,063
Stateandlocal 13,663 11,396 14,582
Canada 131 24 133
Totalcurrent $88,915 $79,598 $102,778
Deferred(principallyU.S.) 19,621 35,890 22,743
Totalincometaxes $108,536 $115,488 $125,521
During fiscal 2004, 2003, and 2002, we paid income taxes of
$92,265, $65,398, and $56,839, respectively.
The following table is a reconciliation of the U.S. statutory
income tax rate to the effective income tax rate included in the
accompanying consolidated statements of earnings:
FiscalYear
2004 2003 2002
U.S.statutoryrate 35.0% 35.0% 35.0%
Stateandlocalincometaxes,
netoffederaltaxbenefits 3.2 3.0 3.1
Benefitoffederalincometaxcredits (5.2) (4.5) (3.9)
Other,net (1.1) (0.3) 0.4
Effectiveincometaxrate 31.9% 33.2% 34.6%
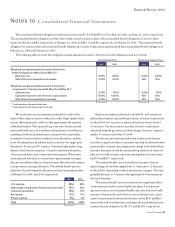
The tax effects of temporary differences that give rise to
deferred tax assets and liabilities are as follows:
May30, May25,
2004 2003
Accruedliabilities $13,286 $12,616
Compensationandemployeebenefits 63,234 55,935
Assetdispositionandrestructuringliabilities 2,651 2,004
Other 2,918 2,638
Grossdeferredtaxassets $82,089 $73,193
Buildingsandequipment (143,910) (116,148)
Prepaidpensioncosts (25,452) (25,987)
Prepaidinterest (1,333) (1,454)
Deferredrentandinterestincome (15,432) (13,117)
Capitalizedsoftwareandotherassets (15,976) (16,115)
Other (944) (1,703)
Grossdeferredtaxliabilities $(203,047) $(174,524)
Netdeferredtaxliabilities $(120,958) $(101,331)
A valuation allowance for deferred tax assets is provided when
it is more likely than not that some portion or all of the deferred tax
assets will not be realized. Realization is dependent upon the genera-
tion of future taxable income or the reversal of deferred tax liabilities
during the periods in which those temporary differences become
deductible. We consider the scheduled reversal of deferred tax
liabilities, projected future taxable income, and tax planning strategies
in making this assessment. At May 30, 2004, and May 25, 2003,
no valuation allowance has been recognized for deferred tax assets
because we believe that sufficient projected future taxable income will
be generated to fully utilize the benefits of these deductible amounts.
47
Financial Review 2004