Red Lobster 2004 Annual Report Download - page 24
Download and view the complete annual report
Please find page 24 of the 2004 Red Lobster annual report below. You can navigate through the pages in the report by either clicking on the pages listed below, or by using the keyword search tool below to find specific information within the annual report.-
 1
1 -
2
-
3
-
4
-
5
-
6
-
7
-
8
-
9
-
10
-
11
-
12
-
13
-
 14
14 -
 15
15 -
 16
16 -
 17
17 -
 18
18 -
 19
19 -
 20
20 -
 21
21 -
 22
22 -
 23
23 -
 24
24 -
 25
25 -
 26
26 -
 27
27 -
 28
28 -
 29
29 -
 30
30 -
 31
31 -
 32
32 -
 33
33 -
 34
34 -
35
-
36
-
37
-
38
-
39
-
40
-
41
-
42
-
43
-
44
-
45
-
46
-
47
-
48
-
49
-
50
-
51
-
52
-
53
-
54
-
55
-
56
-
57
-
58
 |
 |

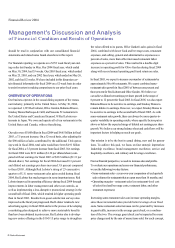
Management's Discussion and Analysis
of Financial Condition and Results of Operations
Olive Garden sales of $2.21 billion were 11.1 percent above last
year. U.S. same-restaurant sales for Olive Garden increased 4.6 per-
cent due to a 3.0 percent increase in average check and a 1.6 percent
increase in same-restaurant guest counts. Average annual sales per
Financial Review 2004
restaurant for Olive Garden were $4.1 million in fiscal 2004 (on a
52-week basis). Olive Garden has enjoyed 39 consecutive quarters
of U.S. same-restaurant sales increases.
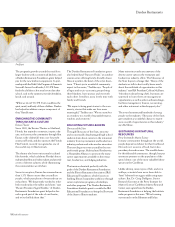
Bahama Breeze sales of $176 million were 28 percent above last
year. Bahama Breeze opened four new restaurants during fiscal 2004,
including its new prototype restaurant in Pittsburgh, PA. Bahama
Breeze also closed six restaurants during the fourth quarter of
fiscal 2004 as a result of a comprehensive analysis performed dur-
ing the fourth quarter of fiscal 2004 that examined restaurants not
meeting our minimum return-on-investment thresholds and certain
other operating performance criteria. Average annual sales per
restaurant (excluding the six closed restaurants) were $5.2 million
(on a 52-week basis). Smokey Bones sales of $ 174 million were
87 percent above last year. Average annual sales per restaurant
were $3.2 million (on a 52-week basis). Smokey Bones opened
30 new restaurants during fiscal 2004.
The 6.6 percent increase in company-wide sales for fiscal 2003 ver-
sus fiscal 2002 was primarily due to same-restaurant sales increases in
the U.S. and a net increase of 60 company-owned restaurants since
fiscal 2002. Red Lobster sales of $2.43 billion were 4.1 percent above
fiscal 2002. U.S. same-restaurant sales for Red Lobster increased
2.7 percent due to a 3.1 percent increase in average check, partially
offset by a 0.4 percent decrease in same-restaurant guest counts.
Average annual sales per restaurant for Red Lobster were $3.7 mil-
lion in fiscal 2003. Olive Garden sales of $ 1.99 billion were 6.8 per-
cent above fiscal 2002. U.S. same-restaurant sales for Olive Garden
increased 2.2 percent due to a 3.7 percent increase in average check
and a 1.5 percent decrease in same-restaurant guest counts. Average
annual sales per restaurant for Olive Garden were $3.9 million in
fiscal 2003. Bahama Breeze opened five new restaurants during fiscal
2003 and generated sales that exceeded $ 137 million. Smokey Bones
opened 20 new restaurants during fiscal 2003 and generated sales of
$93 million.
COSTS AND EXPENSES
Total costs and expenses were $4.66 billion in fiscal 2004, $4.31 billion
in fiscal 2003, and $4.00 billion in fiscal 2002. Total costs and expenses
in fiscal 2004 were 93.2 percent of sales, an increase from 92.5 percent
of sales in fiscal 2003. The following analysis of the components of
total costs and expenses is presented as a percent of sales.
Food and beverage costs increased $78 million, or 5.4 percent, from
$ 1.45 billion to $ 1.53 billion in fiscal 2004 compared to fiscal 2003.
Food and beverage costs increased $65 million, or 4.7 percent,
from $1.38 billion to $ 1.45 billion in fiscal 2003 compared to fiscal
2002. As a percent of sales, food and beverage costs decreased from
the prior year in fiscal 2004 and fiscal 2003 primarily as a result of
pricing changes, and favorable changes in promotional and menu
mix of sales, which was partially offset by higher seafood costs and
by crab usage and additional plate accompaniments at Red Lobster
during its crab promotion in the first quarter of fiscal 2004. Other
commodity costs, such as chicken and shrimp, decreased modestly.
Restaurant labor increased $ 116 million, or 7.8 percent, from
$ 1.49 billion to $ 1.60 billion in fiscal 2004 compared to fiscal 2003.
Restaurant labor increased $ 112 million, or 8.1 percent, from
$1.37 billion to $ 1.49 billion in fiscal 2003 compared to fiscal 2002.
As a percent of sales, restaurant labor increased in fiscal 2004 primar-
ily as a result of a modest increase in wage rates at Red Lobster and
Olive Garden, and higher manager bonuses at Olive Garden as a
result of their increased operating performance in fiscal 2004. These
factors were only partially offset by the favorable impact of higher
sales volumes and lower health insurance costs as a result of fewer
claims. As a percent of sales, restaurant labor increased in fiscal 2003
primarily as a result of a modest increase in wage rates, higher pro-
motional staffing levels, and increased sales volatility, which made
it more difficult to predict staffing needs. These factors were only
partially offset by the favorable impact of higher sales volumes.
Restaurant expenses (which include lease, property tax, credit card,
utility, workers' compensation, insurance, new restaurant pre-
opening, and other restaurant-level operating expenses) increased
$64 million, or 9.1 percent, from $704 million to $768 million in
fiscal 2004 compared to fiscal 2003. Restaurant expenses increased
$75 million, or 11.9 percent, from $629 million to $704 million in
fiscal 2003 compared to fiscal 2002. As a percent of sales, restaurant
expenses increased in fiscal 2004 and fiscal 2003 primarily due to
increased utility, workers' compensation, insurance, and new res-
taurant pre-opening costs. These cost increases were only partially
offset by the favorable impact of higher sales volumes.
24 Darden Restaurants