Red Lobster 2004 Annual Report Download - page 23
Download and view the complete annual report
Please find page 23 of the 2004 Red Lobster annual report below. You can navigate through the pages in the report by either clicking on the pages listed below, or by using the keyword search tool below to find specific information within the annual report.-
 1
1 -
2
-
3
-
4
-
5
-
6
-
7
-
8
-
9
-
10
-
11
-
12
-
 13
13 -
 14
14 -
 15
15 -
 16
16 -
 17
17 -
 18
18 -
 19
19 -
 20
20 -
 21
21 -
 22
22 -
 23
23 -
 24
24 -
 25
25 -
 26
26 -
 27
27 -
 28
28 -
 29
29 -
 30
30 -
 31
31 -
 32
32 -
 33
33 -
34
-
35
-
36
-
37
-
38
-
39
-
40
-
41
-
42
-
43
-
44
-
45
-
46
-
47
-
48
-
49
-
50
-
51
-
52
-
53
-
54
-
55
-
56
-
57
-
58
 |
 |

Financial Review 2004
we gather sales data daily and regularly analyze the guest traffic
counts and the mix of menu items sold to assist in developing menu
pricing, product offerings, and promotional strategies. We view
guest traffic counts as an indication of the long-term health of a
concept, while increases in average check and menu mix may con-
tribute more significantly to near-term profitability. We continually
focus on balancing our pricing and product offerings with other
initiatives to generate sustainable growth in same-restaurant sales.
Incremental same-restaurant sales increases make a significant
contribution to our profitability. Many restaurant-level expenses
are relatively fixed in nature and do not vary with sales volumes.
Therefore, same-restaurant sales increases can improve our profit-
ability. We define same-restaurants as restaurants that have been
open at least 16 months. New restaurants experience an adjustment
period before sales levels and operating margins normalize, and
sales at newly opened restaurants generally do not make a signif-
icant contribution to profitability in their initial months of opera-
tion. Our sales and expenses can be impacted significantly by the
number and timing of the opening of new restaurants, and the closing,
relocation, and remodeling of existing restaurants. Pre-opening
expenses each period reflect the costs associated with opening new
restaurants in current and future periods.
There are significant risks and challenges that could impact our oper-
ations and ability to increase sales and earnings. The casual dining
restaurant industry is highly competitive and sensitive to economic
turns, trends in lifestyles and fluctuating costs. Operating margins for
our concepts are susceptible to changes in the price of commodities,
including seafood, beef, pork, chicken, cheese, produce, natural gas,
and other energy supplies. Other risks and uncertainties include the
price and availability of labor, insurance and media,- possible unfavor-
able publicity relating to food safety or other concerns,- government
regulation and litigation,- and factors that could impact our growth
plans, including the availability of suitable restaurant locations, con-
struction cost increases, construction delays, and other factors.
RESULTS OF OPERATIONS FOR FISCAL 2004,2003
AND 2002
The following table sets forth selected operating data as a per-
centage of sales for the 53-week period ended May 30, 2004, and
the 52-week periods ended May 25, 2003, and May 26, 2002.
All information is derived from the consolidated statements of
earnings for the periods indicated.
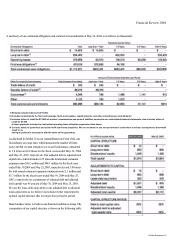
SALES
Sales were $5.00 billion in fiscal 2004, $4.65 billion in fiscal 2003,
and $4.37 billion in fiscal 2002. The 7.5% increase in company-
wide sales for fiscal 2004 was primarily due to a net increase of 54
company-owned restaurants since fiscal 2003, same-restaurant sales
increases at Olive Garden, and the additional operating week in
fiscal 2004. These sales increases were partially offset by decreased
same-restaurant sales at Red Lobster. After adjusting for $90 million
of sales contributed by the additional operating week, total sales
would have been $4.91 billion for fiscal 2004 on a 52-week basis,
a 5.5 percent increase from fiscal 2003.
Red Lobster sales of $2.44 billion were 0.1 percent above last year.
U.S. same-restaurant sales for Red Lobster decreased 3.5 percent
due to a 6.5 percent decrease in same-restaurant guest counts,
offset partially by a 3.0 percent increase in average check. Average
annual sales per restaurant for Red Lobster were $3.6 million in
fiscal 2004 (on a 52-week basis).
Darden Restaurants 23