Radio Shack 2010 Annual Report Download - page 78
Download and view the complete annual report
Please find page 78 of the 2010 Radio Shack annual report below. You can navigate through the pages in the report by either clicking on the pages listed below, or by using the keyword search tool below to find specific information within the annual report.-
 1
1 -
2
-
3
-
4
-
5
-
6
-
7
-
8
-
9
-
10
-
11
-
12
-
13
-
14
-
15
-
16
-
17
-
18
-
19
-
20
-
21
-
22
-
23
-
24
-
25
-
26
-
27
-
28
-
29
-
30
-
31
-
32
-
33
-
34
-
35
-
36
-
37
-
38
-
39
-
40
-
41
-
42
-
43
-
44
-
45
-
46
-
47
-
48
-
49
-
50
-
51
-
52
-
53
-
54
-
55
-
56
-
57
-
58
-
59
-
60
-
61
-
62
-
63
-
64
-
65
-
66
-
67
-
 68
68 -
 69
69 -
 70
70 -
 71
71 -
 72
72 -
 73
73 -
 74
74 -
 75
75 -
 76
76 -
 77
77 -
 78
78 -
 79
79 -
 80
80 -
 81
81 -
 82
82 -
 83
83 -
 84
84 -
 85
85 -
 86
86 -
 87
87 -
 88
88
 |
 |

68
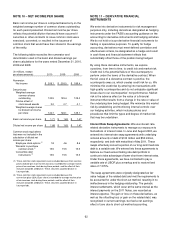
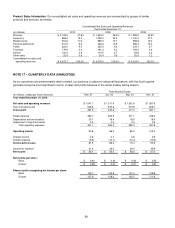
Product Sales Information: Our consolidated net sales and operating revenues are summarized by groups of similar
products and services, as follows:
Consolidated Net Sales and Operating Revenues
Year Ended December 31,
(In millions) 2010 2009 2008
Wireless $ 2,128.2 47.6% $ 1,634.3 38.2% $ 1,388.5 32.9%
Accessory
858.2 19.2 1,036.3 24.2 1,140.0 27.0
Modern home 516.6 11.5 585.3 13.7 556.8 13.2
Personal electronics 412.5 9.2 463.6 10.9 565.4 13.4
Power 222.0 5.0 225.3 5.3 243.1 5.7
Technical 179.5 4.0 181.3 4.2 184.5 4.4
Service 130.3 2.9 114.5 2.7 93.8 2.2
Other sales 25.4 0.6 35.4 0.8 52.4 1.2
Consolidated net sales and
operating revenues
$ 4,472.7
100.0%
$ 4,276.0
100.0%
$ 4,224.5
100.0%
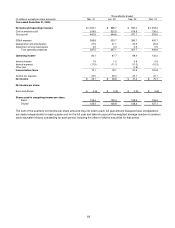
NOTE 17 – QUARTERLY DATA (UNAUDITED)
As our operations are predominantly retail oriented, our business is subject to seasonal fluctuations, with the fourth quarter
generally being the most significant in terms of sales and profits because of the winter holiday selling season.
Three Months Ended
(In millions, except per share amounts) Mar. 31 Jun. 30 Sep. 30 Dec. 31
Year ended December 31, 2010:
Net sales and operating revenues $ 1,041.7 $ 1,011.4 $ 1,051.8 $ 1,367.8
Cost of products sold 549.8 530.8 574.8 806.7
Gross profit 491.9 480.6 477.0 561.1
SG&A expense 380.7 364.5 371.1 438.4
Depreciation and amortization 20.1 19.4 18.5 18.5
Impairment of long-lived assets 0.3 0.4 2.4 0.9
Total operating expenses 401.1 384.3 392.0 457.8
Operating income 90.8 96.3 85.0 103.3
Interest income 0.6 0.7 0.8 0.5
Interest expense (9.9) (10.7) (10.4) (10.9)
Income before taxes 81.5 86.3 75.4 92.9
Income tax expense 31.4 33.3 29.4 35.9
Net income $ 50.1 $ 53.0 $ 46.0 $ 57.0
Net income per share:
Basic $ 0.40 $ 0.42 $ 0.38 $ 0.52
Diluted $ 0.39 $ 0.41 $ 0.37 $ 0.51
Shares used in computing net income per share:
Basic 125.7 125.8 121.0 109.8
Diluted 127.9 128.2 123.1 111.9