Radio Shack 2010 Annual Report Download - page 52
Download and view the complete annual report
Please find page 52 of the 2010 Radio Shack annual report below. You can navigate through the pages in the report by either clicking on the pages listed below, or by using the keyword search tool below to find specific information within the annual report.-
 1
1 -
2
-
3
-
4
-
5
-
6
-
7
-
8
-
9
-
10
-
11
-
12
-
13
-
14
-
15
-
16
-
17
-
18
-
19
-
20
-
21
-
22
-
23
-
24
-
25
-
26
-
27
-
28
-
29
-
30
-
31
-
32
-
33
-
34
-
35
-
36
-
37
-
38
-
39
-
40
-
41
-
 42
42 -
 43
43 -
 44
44 -
 45
45 -
 46
46 -
 47
47 -
 48
48 -
 49
49 -
 50
50 -
 51
51 -
 52
52 -
 53
53 -
 54
54 -
 55
55 -
 56
56 -
 57
57 -
 58
58 -
 59
59 -
 60
60 -
 61
61 -
 62
62 -
63
-
64
-
65
-
66
-
67
-
68
-
69
-
70
-
71
-
72
-
73
-
74
-
75
-
76
-
77
-
78
-
79
-
80
-
81
-
82
-
83
-
84
-
85
-
86
-
87
-
88
 |
 |

42
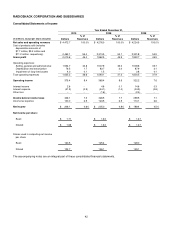
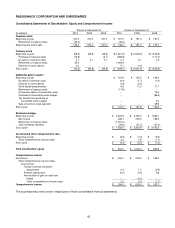
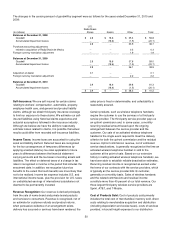
RADIOSHACK CORPORATION AND SUBSIDIARIES
Consolidated Statements of Income
Year Ended December 31,
2010 2009 2008
% of % of % of
(In millions, except per share amounts) Dollars Revenues Dollars Revenues Dollars Revenues
Net sales and operating revenues $ 4,472.7 100.0%
$ 4,276.0 100.0%
$ 4,224.5 100.0%
Cost of products sold (includes
depreciation amounts of
$7.7 million, $9.2 million and
$11.2 million, respectively)
2,462.1
55.0
2,313.5
54.1
2,301.8
54.5
Gross profit 2,010.6 45.0 1,962.5 45.9 1,922.7 45.5
Operating expenses:
Selling, general and administrative 1,554.7 34.8 1,507.9 35.3 1,509.8 35.7
Depreciation and amortization 76.5 1.7 83.7 2.0 87.9 2.1
Impairment of long-lived assets 4.0 0.1 1.5 -- 2.8 0.1
Total operating expenses 1,635.2 36.6 1,593.1 37.3 1,600.5 37.9
Operating income 375.4 8.4 369.4 8.6 322.2 7.6
Interest income 2.6 -- 4.8 0.1 14.6 0.3
Interest expense (41.9)
(0.9) (44.1) (1.0) (34.9) (0.8)
Other loss -- -- (1.6) -- (2.4) --
Income before income taxes 336.1 7.5 328.5 7.7 299.5 7.1
Income tax expense 130.0 2.9 123.5 2.9 110.1 2.6
Net income $ 206.1 4.6%
$ 205.0 4.8%
$ 189.4 4.5%
Net income per share:
Basic $ 1.71
$ 1.63
$ 1.47
Diluted: $ 1.68
$ 1.63
$ 1.47
Shares used in computing net income
per share:
Basic 120.5 125.4 129.0
Diluted 122.7 126.1 129.1
The accompanying notes are an integral part of these consolidated financial statements.