Radio Shack 2010 Annual Report Download - page 35
Download and view the complete annual report
Please find page 35 of the 2010 Radio Shack annual report below. You can navigate through the pages in the report by either clicking on the pages listed below, or by using the keyword search tool below to find specific information within the annual report.-
 1
1 -
2
-
3
-
4
-
5
-
6
-
7
-
8
-
9
-
10
-
11
-
12
-
13
-
14
-
15
-
16
-
17
-
18
-
19
-
20
-
21
-
22
-
23
-
24
-
 25
25 -
 26
26 -
 27
27 -
 28
28 -
 29
29 -
 30
30 -
 31
31 -
 32
32 -
 33
33 -
 34
34 -
 35
35 -
 36
36 -
 37
37 -
 38
38 -
 39
39 -
 40
40 -
 41
41 -
 42
42 -
 43
43 -
 44
44 -
 45
45 -
46
-
47
-
48
-
49
-
50
-
51
-
52
-
53
-
54
-
55
-
56
-
57
-
58
-
59
-
60
-
61
-
62
-
63
-
64
-
65
-
66
-
67
-
68
-
69
-
70
-
71
-
72
-
73
-
74
-
75
-
76
-
77
-
78
-
79
-
80
-
81
-
82
-
83
-
84
-
85
-
86
-
87
-
88
 |
 |

25
Compensation expense increased in dollars and as a
percentage of net sales and operating revenues. This
increase was driven by incentive compensation paid on
increased wireless sales and the hiring of additional
employees to support our Target kiosk locations.
Advertising expense was higher in 2010 primarily due to
incremental advertising related to brand building in the
second quarter of 2010.
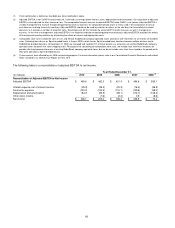
Depreciation and Amortization
The table below provides a summary of our total
depreciation and amortization by segment.
Year Ended December 31,
(In millions) 2010 2009
2008
U.S. RadioShack
company-operated stores
$ 45.4
$ 45.8
$ 52.9
Kiosks 2.3
3.2 5.8
Other 3.7
5.8 1.8
Unallocated 32.8
38.1 38.6
Total depreciation and
amortization
$ 84.2
$ 92.9
$ 99.1
The table below provides an analysis of total depreciation
and amortization.
Year Ended December 31,
(In millions) 2010 2009
2008
Depreciation and
amortization expense
$ 76.5
$ 83.7
$ 87.9
Depreciation and
amortization included
in cost of products sold
7.7
9.2
11.2
Total depreciation and
amortization
$ 84.2
$ 92.9
$ 99.1
Total depreciation and amortization for 2010 declined $8.7
million or 9.4%. Our depreciation expense has been
trending lower over the past five years due to our lower
level of capital expenditures during this time compared with
a higher level of capital expenditures in 2005 and prior
years.
Impairment of Long-Lived Assets
Impairment of long-lived assets was $4.0 million and $1.5
million in 2010 and 2009, respectively. In 2010, this amount
was related primarily to underperforming U.S. RadioShack
company-operated stores and certain test store formats. In
2009, these amounts were related primarily to
underperforming U.S. RadioShack company-operated
stores and kiosk locations.
Net Interest Expense
Consolidated net interest expense, which is interest
expense net of interest income, was $ 39.3 million in both
2010 and 2009.
In 2010, interest expense primarily consisted of interest
paid at the stated coupon rate on our outstanding notes, the
non-cash amortization of the discount on our convertible
notes, cash received on our interest rate swaps, and the
non-cash change in fair value of our interest rate swaps.
Interest expense decreased $2.2 million in 2010. This
decrease was primarily driven by the reduced principal
balance of our long-term notes due in May 2011 resulting
from the September 2009 repurchase of $43.2 million of the
principal amount of our notes and increased payments
received on our interest rate swap contracts during 2010.
Non-cash interest expense was $15.2 million in 2010
compared with $13.7 million in 2009.
Interest income decreased $2.2 million in 2010. This
decrease was primarily due to lower average cash
balances in the second half of 2010.
Income Tax Expense
Our effective tax rate for 2010 was 38.7%, compared with
37.6% for 2009. The 2010 effective tax rate was affected by
the net reversal of approximately $1.2 million in previously
unrecognized tax benefits, deferred tax assets and accrued
interest due to the effective settlement of state income tax
matters during the period. These discrete items lowered the
effective tax rate by 0.4 percentage points.
The 2009 effective tax rate was affected by the net reversal
of approximately $6.1 million in previously unrecognized tax
benefits, deferred tax assets and accrued interest due to
the effective settlement of state income tax matters during
the period. These discrete items lowered the effective tax
rate by 1.9 percentage points.
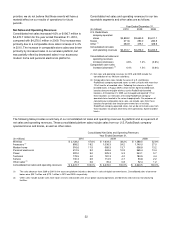
2009 COMPARED WITH 2008
Net Sales and Operating Revenues
Consolidated net sales increased 1.2% or $51.5 million to
$4,276.0 million for the year ended December 31, 2009,
compared with $4,224.5 million in 2008. This increase was
primarily due to a comparable store sales increase of 1.3%
in 2009. The increase in comparable store sales was driven
primarily by increased sales in our wireless and modern
home platforms, but was partially offset by decreased sales
in our accessory and personal electronics platforms.
U.S. RadioShack Company-Operated Stores Segment
Sales in our wireless platform increased 25.3% in 2009.
This sales increase was driven by increased sales in our
Sprint postpaid wireless business, the addition of T-Mobile
as a postpaid wireless carrier, and increased sales of
prepaid wireless handsets. These increases were partially
offset by decreased sales of GPS products.
Sales in our accessory platform decreased 10.2% in 2009.
This sales decrease was primarily driven by decreased