Radio Shack 2010 Annual Report Download - page 34
Download and view the complete annual report
Please find page 34 of the 2010 Radio Shack annual report below. You can navigate through the pages in the report by either clicking on the pages listed below, or by using the keyword search tool below to find specific information within the annual report.-
 1
1 -
2
-
3
-
4
-
5
-
6
-
7
-
8
-
9
-
10
-
11
-
12
-
13
-
14
-
15
-
16
-
17
-
18
-
19
-
20
-
21
-
22
-
23
-
 24
24 -
 25
25 -
 26
26 -
 27
27 -
 28
28 -
 29
29 -
 30
30 -
 31
31 -
 32
32 -
 33
33 -
 34
34 -
 35
35 -
 36
36 -
 37
37 -
 38
38 -
 39
39 -
 40
40 -
 41
41 -
 42
42 -
 43
43 -
 44
44 -
45
-
46
-
47
-
48
-
49
-
50
-
51
-
52
-
53
-
54
-
55
-
56
-
57
-
58
-
59
-
60
-
61
-
62
-
63
-
64
-
65
-
66
-
67
-
68
-
69
-
70
-
71
-
72
-
73
-
74
-
75
-
76
-
77
-
78
-
79
-
80
-
81
-
82
-
83
-
84
-
85
-
86
-
87
-
88
 |
 |

24
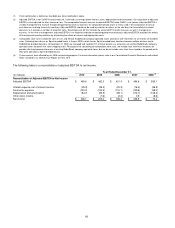
Other Sales
Other sales include sales to our independent dealers,
outside sales through our service centers, sales generated
by our www.radioshack.com website and our Mexican
subsidiary, sales to commercial customers, and outside
sales of our global sourcing operations and manufacturing.
Other sales increased $17.8 million or 4.7% in 2010. This
sales increase was driven primarily by increased sales at
our Mexican subsidiary and increased sales to our
independent dealers, but was partially offset by decreased
sales from www.radioshack.com and our global sourcing
and manufacturing operations. Our Mexican subsidiary
accounted for less than 5% of consolidated net sales and
operating revenues in 2010.
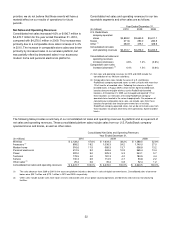
Gross Profit
Consolidated gross profit and gross margin are as follows:
Year Ended December 31,
(In millions) 2010
2009
2008
Gross profit $2,010.6
$1,962.5
$1,922.7
Gross profit increase (decrease) 2.5%
2.1%
(5.1%)
Gross margin 45.0%
45.9%
45.5%
Consolidated gross profit and gross margin for 2010 were
$2,010.6 million and 45.0%, respectively, compared with
$1,962.5 million and 45.9%, respectively, in 2009, resulting
in a 2.5% increase in gross profit dollars and a 90 basis
point decrease in our gross margin.
The increase in gross profit dollars was primarily due to
increased sales, but was partially offset by decreased gross
margin. Gross margin declined primarily due to a higher
sales mix of lower margin wireless handsets and
incremental promotional and clearance markdowns
associated with seasonal sell-through and product
transitions in non-wireless platforms.
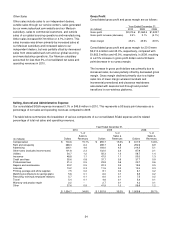
Selling, General and Administrative Expense
Our consolidated SG&A expense increased 3.1% or $46.8 million in 2010. This represents a 50 basis point decrease as a
percentage of net sales and operating revenues compared to 2009.
The table below summarizes the breakdown of various components of our consolidated SG&A expense and its related
percentage of total net sales and operating revenues.
Year Ended December 31,
2010 2009 2008
Dollars
% of
Sales &
Revenues
Dollars
% of
Sales &
Revenues
Dollars
% of
Sales &
Revenues
(In millions)
Compensation $ 700.6
15.7%
$ 655.7
15.3%
$ 617.5
14.6%
Rent and occupancy 288.3
6.4
289.7
6.8
292.6
6.9
Advertising
206.1
4.6
193.0
4.5
214.5
5.1
Other taxes (excludes income taxes) 101.8
2.3
102.0
2.4
87.9
2.1
Utilities 54.7
1.2
55.3
1.3
58.7
1.4
Insurance 48.8
1.1
47.5
1.1
55.0
1.3
Credit card fees 35.6
0.8
37.7
0.9
37.7
0.9
Professional fees 21.4
0.5
23.9
0.6
23.7
0.6
Repairs and maintenance 20.2
0.5
22.3
0.5
19.5
0.5
Licenses 13.2
0.3
11.5
0.3
12.4
0.3
Printing, postage and office supplies 7.5
0.2
8.1
0.2
8.1
0.2
Matching contributions to savings plans 5.6
0.1
6.0
0.1
6.5
0.2
Recruiting, training & employee relations 5.7
0.1
6.0
0.1
7.5
0.2
Travel 5.4
0.1
4.6
0.1
5.4
0.1
Warranty and product repair 2.2
--
2.7
0.1
4.2
0.1
Other 37.6
0.9
41.9
1.0
58.6
1.2
$ 1,554.7
34.8%
$ 1,507.9
35.3%
$ 1,509.8
35.7%