Radio Shack 2010 Annual Report Download - page 33
Download and view the complete annual report
Please find page 33 of the 2010 Radio Shack annual report below. You can navigate through the pages in the report by either clicking on the pages listed below, or by using the keyword search tool below to find specific information within the annual report.-
 1
1 -
2
-
3
-
4
-
5
-
6
-
7
-
8
-
9
-
10
-
11
-
12
-
13
-
14
-
15
-
16
-
17
-
18
-
19
-
20
-
21
-
22
-
 23
23 -
 24
24 -
 25
25 -
 26
26 -
 27
27 -
 28
28 -
 29
29 -
 30
30 -
 31
31 -
 32
32 -
 33
33 -
 34
34 -
 35
35 -
 36
36 -
 37
37 -
 38
38 -
 39
39 -
 40
40 -
 41
41 -
 42
42 -
 43
43 -
44
-
45
-
46
-
47
-
48
-
49
-
50
-
51
-
52
-
53
-
54
-
55
-
56
-
57
-
58
-
59
-
60
-
61
-
62
-
63
-
64
-
65
-
66
-
67
-
68
-
69
-
70
-
71
-
72
-
73
-
74
-
75
-
76
-
77
-
78
-
79
-
80
-
81
-
82
-
83
-
84
-
85
-
86
-
87
-
88
 |
 |

23
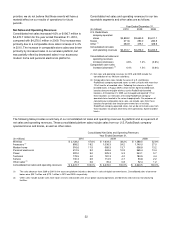
U.S. RadioShack Company-Operated Stores Segment
The following table provides a summary of our net sales and operating revenues by platform and as a percent of net sales and
operating revenues for the U.S. RadioShack company-operated stores segment.
Net Sales and Operating Revenues
Year Ended December 31,
(In millions) 2010 2009 2008
Wireless $ 1,784.0 46.8%
$ 1,342.1 36.8%
$ 1,070.7 29.7%
Accessory
773.6 20.3
946.0 25.9
1,054.0 29.2
Modern home 421.3 11.1
489.8 13.4
483.7 13.4
Personal electronics 337.0 8.9
391.1 10.7
503.9 14.0
Power 198.9 5.2
204.7 5.6
227.3 6.3
Technical 164.6 4.3
167.3 4.6
170.9 4.7
Service 117.6 3.1
107.6 2.9
91.4 2.5
Other 11.2 0.3
2.3 0.1
9.2 0.2
Net sales and operating revenues $ 3,808.2 100.0%
$ 3,650.9 100.0%
$ 3,611.1 100.0%
Sales in our wireless platform (includes postpaid and
prepaid wireless handsets, commissions, residual income
and communication devices such as scanners and GPS
products) increased 32.9% in 2010. This sales increase
was driven by increased sales in our Sprint and AT&T
postpaid wireless business and increased sales of prepaid
wireless handsets. These increases were partially offset by
decreased sales of GPS products. The inclusion of T-
Mobile as a postpaid wireless carrier increased sales for
the first nine months of 2010; however, T-Mobile sales
decreased in the fourth quarter, when compared to the
same period last year.
Sales in our accessory platform (includes home
entertainment, wireless, music, computer and video game
accessories; media storage; power adapters; digital
imaging products and headphones) decreased 18.2% in
2010. This sales decrease was primarily driven by
decreased sales of digital converter boxes and television
antennas, but was partially offset by increased sales of
wireless accessories. Consolidated sales of converter
boxes were $33.7 million and $170.1 million in 2010 and
2009, respectively. Converter box sales have decreased
since the transition to digital television occurred in June
2009. We expect sales of converter boxes to be minimal in
2011.
Sales in our modern home platform (includes home audio
and video end-products, personal computing products, and
residential telephones) decreased 14.0% in 2010. This
decrease was driven primarily by decreased sales of digital
televisions and netbooks, but was partially offset by
increased sales of laptops.
Sales in our personal electronics platform (includes digital
cameras, digital music players, toys, satellite radios, video
gaming hardware, camcorders, and general radios)
decreased 13.8% in 2010. This decrease was driven by
sales declines in substantially all categories in this platform.
Sales in our power platform (includes general and special
purpose batteries and battery chargers) decreased 2.8% in
2010. This decrease was primarily driven by decreased
sales of both general and special purpose batteries, but
was partially offset by increased sales of battery chargers.
Sales in our technical platform (includes wire and cable,
connectivity products, components and tools, and hobby
products) decreased 1.6% in 2010. This decrease was
driven by decreased sales of connectivity products.
Sales in our service platform (includes prepaid wireless
airtime, extended service plans, and bill payment revenue)
increased 9.3% in 2010. This increase was driven primarily
by increased sales of prepaid wireless airtime.
Kiosks Segment
Kiosk sales consist primarily of handset sales, postpaid and
prepaid commission revenue and related wireless
accessory sales. Kiosk sales increased 8.6% or $21.6
million in 2010. This increase was driven primarily by new
sales in our Target kiosks and increased sales in our Sam’s
Club kiosks, but was partially offset by the closure of our
Sprint-branded kiosk business. We closed our Sprint-
branded kiosks in the third quarter of 2009.
As previously disclosed, in February 2009 we signed a
contract extension with Sam’s Club through March 31,
2011, with a transition period ending June 30, 2011, to
continue operating wireless kiosks in certain Sam’s Club
stores. As of December 31, 2010, we operated 417 of these
kiosks. Accordingly, this transition will begin on April 1,
2011, and conclude on June 30, 2011, with the assignment
to Sam’s Club of all kiosks operated by the Company in
Sam’s Club stores.