Radio Shack 2010 Annual Report Download - page 37
Download and view the complete annual report
Please find page 37 of the 2010 Radio Shack annual report below. You can navigate through the pages in the report by either clicking on the pages listed below, or by using the keyword search tool below to find specific information within the annual report.-
 1
1 -
2
-
3
-
4
-
5
-
6
-
7
-
8
-
9
-
10
-
11
-
12
-
13
-
14
-
15
-
16
-
17
-
18
-
19
-
20
-
21
-
22
-
23
-
24
-
25
-
26
-
 27
27 -
 28
28 -
 29
29 -
 30
30 -
 31
31 -
 32
32 -
 33
33 -
 34
34 -
 35
35 -
 36
36 -
 37
37 -
 38
38 -
 39
39 -
 40
40 -
 41
41 -
 42
42 -
 43
43 -
 44
44 -
 45
45 -
 46
46 -
 47
47 -
48
-
49
-
50
-
51
-
52
-
53
-
54
-
55
-
56
-
57
-
58
-
59
-
60
-
61
-
62
-
63
-
64
-
65
-
66
-
67
-
68
-
69
-
70
-
71
-
72
-
73
-
74
-
75
-
76
-
77
-
78
-
79
-
80
-
81
-
82
-
83
-
84
-
85
-
86
-
87
-
88
 |
 |
27
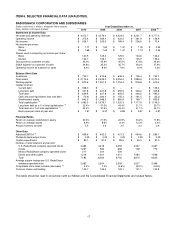
Impairment of Long-Lived Assets
Impairment of long-lived assets was $1.5 million and $2.8
million for 2009 and 2008, respectively. These amounts
were related primarily to underperforming U.S. RadioShack
company-operated stores and kiosk locations.
Net Interest Expense
Consolidated net interest expense, which is interest
expense net of interest income, was $39.3 million for 2009
compared with $20.3 million for 2008.
Interest expense primarily consists of interest paid on the
stated coupon rate for our outstanding bonds, the non-cash
amortization of discounts and premiums on our outstanding
bonds, cash paid or received on our interest rate swaps,
and the non-cash change in fair value of our interest rate
swaps in 2009. Interest expense increased $9.2 million in
2009. This increase was primarily driven by increased
interest expense related to our 2013 convertible notes.
These notes were outstanding for twelve months in 2009
and four months in 2008. This increase was partially offset
by increased payments received on our interest rate swap
contracts in 2009 and the repurchase of $43.2 million of our
notes due in May 2011. Non-cash interest expense was
$13.7 million in 2009 compared with $5.0 million in 2008.
Interest income decreased $9.8 million in 2009. This
decrease was due to a lower interest rate environment in
2009, but was partially offset by larger average cash
balances in 2009.
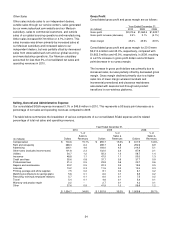
Other Loss
During 2009 we recorded other loss of $1.6 million
compared with other loss of $2.4 million in 2008. The 2009
loss was recognized in conjunction with the repurchase of a
portion of our 2011 Notes. The 2008 loss represented
losses related to our derivative exposure to Sirius XM
Radio, Inc. warrants as a result of our fair value
measurements of these warrants. At December 31, 2008,
the fair value of these warrants was zero, and these
warrants expired in the first quarter of 2009.
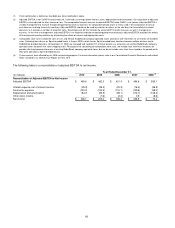
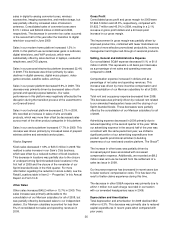
Income Tax Expense
Our effective tax rate for 2009 was 37.6% compared with
36.8% for 2008. The 2009 effective tax rate was affected by
the net reversal of approximately $6.1 million in previously
unrecognized tax benefits, deferred tax assets and accrued
interest due to the effective settlement of state income tax
matters during the period. These discrete items lowered the
effective tax rate by 1.9 percentage points.
The 2008 effective tax rate was affected by the execution of
a closing agreement with respect to a Puerto Rico income
tax matter during the year, which resulted in a credit to
income tax expense; this discrete item lowered the effective
tax rate for 2008 by 1.0 percentage point. In addition, the
2008 effective tax rate was affected by the net reversal of
approximately $4.1 million in unrecognized tax benefits,
deferred tax assets and accrued interest related to the
settlement of various state income tax matters and the
expiration of the statute of limitations with respect to our
2002 taxable year; this net reversal lowered the effective
tax rate for 2008 by 1.4 percentage points.
RECENTLY ISSUED ACCOUNTING
PRONOUNCEMENTS
Refer to Note 2 – “Summary of Significant Accounting
Policies” under the section titled “New Accounting
Standards” in the Notes to Consolidated Financial
Statements.
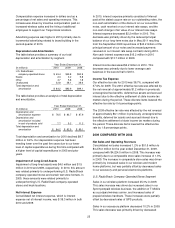
LIQUIDITY AND CAPITAL RESOURCES
Cash Flow Overview
Operating Activities: Cash provided by operating activities
in 2010 was $155.0 million, compared with $245.8 million in
2009. Cash flows from operating activities are comprised of
net income plus non-cash adjustments to net income and
working capital components. Cash provided by net income
plus non-cash adjustments to net income was $343.9
million and $333.7 million in 2010 and 2009, respectively.
Cash used in working capital components was $188.9
million and $87.9 million in 2010 and 2009, respectively.
Our cash used in working capital components in 2010 was
driven by higher accounts receivable and inventory
balances to support our increased wireless business and
our Target kiosk expansion. Cash used in working capital
components in 2010 was also driven by lower accrued
expenses and current liabilities related to insurance, legal
reserves and compensation.
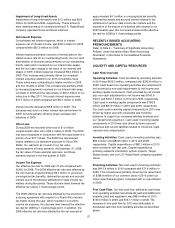
Investing Activities: Cash used in investing activities was
$80.0 million and $80.8 million in 2010 and 2009,
respectively. Capital expenditures of $80.1 million in 2010
were consistent with last year. Capital expenditures
primarily related to information system projects, Target
Mobile kiosks, and our U.S. RadioShack company-operated
stores.
Financing Activities: Net cash used in financing activities
was $413.8 million in 2010 compared with $71.6 million in
2009. This increase was primarily driven by the repurchase
of $398.8 million of our common stock in 2010 under our
share repurchase program, compared with no repurchases
in 2009.
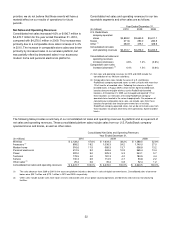
Free Cash Flow: Our free cash flow, defined as cash flows
from operating activities less dividends paid and additions to
property, plant and equipment, was $48.4 million in 2010,
$133.5 million in 2009, and $157.7 million in 2008. The
decrease in free cash flow for 2010 was attributable to
decreased cash flow from operating activities as described
above.