Radio Shack 2010 Annual Report Download - page 36
Download and view the complete annual report
Please find page 36 of the 2010 Radio Shack annual report below. You can navigate through the pages in the report by either clicking on the pages listed below, or by using the keyword search tool below to find specific information within the annual report.-
 1
1 -
2
-
3
-
4
-
5
-
6
-
7
-
8
-
9
-
10
-
11
-
12
-
13
-
14
-
15
-
16
-
17
-
18
-
19
-
20
-
21
-
22
-
23
-
24
-
25
-
 26
26 -
 27
27 -
 28
28 -
 29
29 -
 30
30 -
 31
31 -
 32
32 -
 33
33 -
 34
34 -
 35
35 -
 36
36 -
 37
37 -
 38
38 -
 39
39 -
 40
40 -
 41
41 -
 42
42 -
 43
43 -
 44
44 -
 45
45 -
 46
46 -
47
-
48
-
49
-
50
-
51
-
52
-
53
-
54
-
55
-
56
-
57
-
58
-
59
-
60
-
61
-
62
-
63
-
64
-
65
-
66
-
67
-
68
-
69
-
70
-
71
-
72
-
73
-
74
-
75
-
76
-
77
-
78
-
79
-
80
-
81
-
82
-
83
-
84
-
85
-
86
-
87
-
88
 |
 |
26
sales in digital-to-analog converter boxes, wireless
accessories, imaging accessories, and media storage, but
was partially offset by increased sales of television
antennas. Consolidated sales of converter boxes were
$170.1 million and $204.8 million in 2009 and 2008,
respectively. The decrease in converter box sales occurred
in the second half of the year after the transition to digital
television occurred in June 2009.
Sales in our modern home platform increased 1.3% in
2009. In this platform we recorded sales gains in netbooks,
digital televisions, and VoIP products, which were
substantially offset by sales declines in laptops, residential
telephones, and DVD players.
Sales in our personal electronics platform decreased 22.4%
in 2009. This decrease was driven primarily by sales
declines in digital cameras, digital music players, video
game consoles, satellite radios, and toys.
Sales in our power platform decreased 9.9% in 2009. This
decrease was primarily driven by decreased sales of both
general and special purpose batteries. Our sales
performance in this platform was negatively affected by the
disruption during the transition process of the assortment to
our Enercell brand.
Sales in our technical platform decreased 2.1% in 2009.
We recorded an increase in sales of wire and cable
products, which was more than offset by decreased sales
across most of the other product categories in this platform.
Sales in our service platform increased 17.7% in 2009. This
increase was driven primarily by increased sales of prepaid
wireless airtime and extended service plans.
Kiosks Segment
Kiosk sales decreased 11.8% or $33.5 million in 2009. We
realized a sales increase in our Sam’s Club business,
which was offset by a reduced number of kiosk locations.
This decrease in locations was partially due to the closure
of underperforming Sprint-branded kiosk locations in the
first half of 2009 and the closure of the remainder of our
Sprint-branded kiosks in the third quarter. For more
information regarding the reduction in kiosk outlets, see the
Retail Locations table in Item 2 – “Properties” in this Annual
Report on Form 10-K.
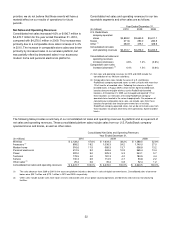
Other Sales
Other sales increased $45.2 million or 13.7% in 2009. This
sales increase was primarily attributable to the
consolidation of our Mexican subsidiary for all of 2009, but
was partially offset by decreased sales to our independent
dealers. Our Mexican subsidiary accounted for less than
5% of consolidated net sales and operating revenues in
2009.
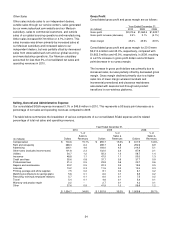
Gross Profit
Consolidated gross profit and gross margin for 2009 were
$1,962.5 million and 45.9%, respectively, compared with
$1,922.7 million and 45.5% in 2008, resulting in a 2.1%
increase in gross profit dollars and a 40 basis point
increase in our gross margin.
The improvement in gross margin was partially driven by
improved product mix, combined with fewer markdowns as
a result of more effective promotional productivity, inventory
management and higher sell-through of seasonal products.
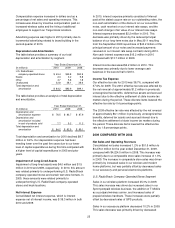
Selling, General and Administrative Expense
Our consolidated SG&A expense decreased 0.1% or $1.9
million in 2009. This represents a 40 basis point decrease
as a percentage of net sales and operating revenues
compared to 2008.
Compensation expense increased in dollars and as a
percentage of net sales and operating revenues. This
increase was driven by more incentive compensation and
the consolidation of our Mexican subsidiary for all of 2009.
Total rent and occupancy expense decreased from 2008.
This decrease was primarily driven by reduced rent related
to our amended headquarters lease and the closing of our
Sprint-branded kiosks. These decreases were partially
offset by the consolidation of our Mexican subsidiary for all
of 2009.
Advertising expense decreased in 2009 primarily due to
reduced spending in the second quarter of the year. While
our advertising expense in the second half of the year was
consistent with the same period last year, we shifted a
significant portion of our advertising expenditures from
product specific promotional activities to building
awareness of our new brand creative platform, The Shack®.
The increase in other taxes was partially driven by
increased payroll taxes associated with increased
compensation expense. Additionally, we recorded an $8.2
million sales and use tax benefit from the settlement of a
sales tax issue in 2008.
Our insurance expense has decreased in recent years due
to lower workers’ compensation costs. This has been the
result of better claims experience during this time.
The decrease in other SG&A expense was primarily due to
a $12.1 million non-cash charge recorded in connection
with our amended headquarters lease in 2008.
Depreciation and Amortization
Total depreciation and amortization for 2009 declined $6.2
million or 6.3%. This decrease was primarily due to reduced
capital expenditures in recent years when compared with
prior years.