Radio Shack 2010 Annual Report Download - page 2
Download and view the complete annual report
Please find page 2 of the 2010 Radio Shack annual report below. You can navigate through the pages in the report by either clicking on the pages listed below, or by using the keyword search tool below to find specific information within the annual report.-
 1
1 -
 2
2 -
 3
3 -
 4
4 -
 5
5 -
 6
6 -
 7
7 -
 8
8 -
 9
9 -
 10
10 -
 11
11 -
 12
12 -
 13
13 -
14
-
15
-
16
-
17
-
18
-
19
-
20
-
21
-
22
-
23
-
24
-
25
-
26
-
27
-
28
-
29
-
30
-
31
-
32
-
33
-
34
-
35
-
36
-
37
-
38
-
39
-
40
-
41
-
42
-
43
-
44
-
45
-
46
-
47
-
48
-
49
-
50
-
51
-
52
-
53
-
54
-
55
-
56
-
57
-
58
-
59
-
60
-
61
-
62
-
63
-
64
-
65
-
66
-
67
-
68
-
69
-
70
-
71
-
72
-
73
-
74
-
75
-
76
-
77
-
78
-
79
-
80
-
81
-
82
-
83
-
84
-
85
-
86
-
87
-
88
 |
 |

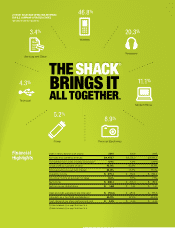
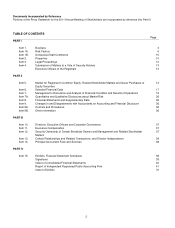
Technical
Accessory
Modern Home
Power
Services and Other
Personal Electronics
Wireless
2010 NET SALES AND OPERATING REVENUES
FOR U.S. COMPANY-OPERATED STORES
(percent by product platform)
46.8%
20.3%
11.1%
8.9%
5.2%
4.3%
(Dollars in millions, except per share amounts) 2010 2009 2008
Net sales and operating revenues $4,472.7 $4,276.0 $4,224.5
Comparable store sales increase (decrease)(1) 4.4% 1.3% (0.6%)
Gross profit as a percent of sales 45.0% 45.9% 45.5%
SG&A expense as a percent of sales 34.8% 35.3% 35.7%
Operating income $375.4 $ 369.4 $ 322.2
Operating income as a percent of sales 8.4% 8.6% 7.6 %
Net income $206.1 $ 205.0 $ 189.4
Net income per diluted share $1.68 $ 1.63 $ 1.47
Cash and cash equivalents less total debt $ (70.4) $ 280.4 $ 155.3
Total debt as a % of total capitalization(2) 43.2% 37.5 % 43.4%
Cash dividends per share declared and paid $0.25 $ 0.25 $ 0.25
(1) Refer to footnote (3) on page 18 of Form 10-K.
(2) Refer to footnote (1) on page 18 of Form 10-K.
Financial
Highlights
BRINGS IT
ALL TOGETHER.
3.4%