Radio Shack 2010 Annual Report Download - page 32
Download and view the complete annual report
Please find page 32 of the 2010 Radio Shack annual report below. You can navigate through the pages in the report by either clicking on the pages listed below, or by using the keyword search tool below to find specific information within the annual report.-
 1
1 -
2
-
3
-
4
-
5
-
6
-
7
-
8
-
9
-
10
-
11
-
12
-
13
-
14
-
15
-
16
-
17
-
18
-
19
-
20
-
21
-
 22
22 -
 23
23 -
 24
24 -
 25
25 -
 26
26 -
 27
27 -
 28
28 -
 29
29 -
 30
30 -
 31
31 -
 32
32 -
 33
33 -
 34
34 -
 35
35 -
 36
36 -
 37
37 -
 38
38 -
 39
39 -
 40
40 -
 41
41 -
 42
42 -
43
-
44
-
45
-
46
-
47
-
48
-
49
-
50
-
51
-
52
-
53
-
54
-
55
-
56
-
57
-
58
-
59
-
60
-
61
-
62
-
63
-
64
-
65
-
66
-
67
-
68
-
69
-
70
-
71
-
72
-
73
-
74
-
75
-
76
-
77
-
78
-
79
-
80
-
81
-
82
-
83
-
84
-
85
-
86
-
87
-
88
 |
 |

22
provider, we do not believe that these events will have a
material effect on our results of operations for future
periods.
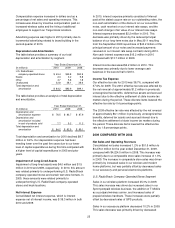
Net Sales and Operating Revenues
Consolidated net sales increased 4.6% or $196.7 million to
$4,472.7 million for the year ended December 31, 2010,
compared with $4,276.0 million in 2009. This increase was
primarily due to a comparable store sales increase of 4.4%
in 2010. The increase in comparable store sales was driven
primarily by increased sales in our wireless platform, but
was partially offset by decreased sales in our accessory,
modern home and personal electronics platforms.
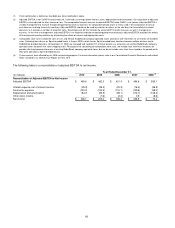
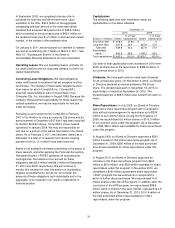
Consolidated net sales and operating revenues for our two
reportable segments and other sales are as follows:
Year Ended December 31,
(In millions) 2010 2009
2008
U.S. RadioShack
company-operated
stores
$3,808.2
$3,650.9
$3,611.1
Kiosks 271.6 250.0 283.5
Other
(1)
392.9 375.1 329.9
Consolidated net sales
and operating revenues
$4,472.7
$4,276.0
$4,224.5
Consolidated net sales and
operating revenues
increase (decrease)
4.6%
1.2%
(0.6%)
Comparable store sales
increase (decrease) (2)
4.4%
1.3%
(0.6%)
(1)
Net sales and operating revenues for 2010 and 2009 include the
consolidation of our Mexican subsidiary.
(2)
Comparable store sales include the sales of U.S. and Mexico
RadioShack company-operated stores as well as kiosks with more than
12 full months of recorded sales. Following their closure as Sprint-
branded kiosks in August 2009, certain former Sprint-branded kiosk
locations became multiple wireless carrier RadioShack-branded
locations. At December 31, 2009, we managed and reported 111 of
these locations as extensions of existing RadioShack company-
operated stores located in the same shopping malls. For purposes of
calculating our comparable store sales, we include sales from these
locations for periods after they became extensions of existing
RadioShack company-operated stores, but we do not include sales from
these locations for periods while they were operated as Sprint-branded
kiosks.
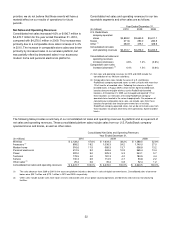
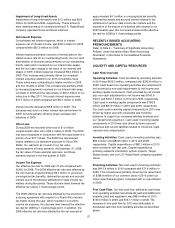
The following table provides a summary of our consolidated net sales and operating revenues by platform and as a percent of
net sales and operating revenues. These consolidated platform sales include sales from our U.S. RadioShack company-
operated stores and kiosks, as well as other sales.
Consolidated Net Sales and Operating Revenues
Year Ended December 31,
(In millions) 2010 2009 2008
Wireless $ 2,128.2 47.6%
$ 1,634.3 38.2%
$ 1,388.5 32.9%
Accessory
(1
)
858.2 19.2
1,036.3 24.2
1,140.0 27.0
Modern home 516.6 11.5
585.3 13.7
556.8 13.2
Personal electronics 412.5 9.2
463.6 10.9
565.4 13.4
Power 222.0 5.0
225.3 5.3
243.1 5.7
Technical 179.5 4.0
181.3 4.2
184.5 4.4
Service 130.3 2.9
114.5 2.7
93.8 2.2
Other sales
(2
)
25.4 0.6
35.4 0.8
52.4 1.2
Consolidated net sales and operating revenues $ 4,472.7 100.0%
$ 4,276.0 100.0%
$ 4,224.5 100.0%
(1) The sales decrease from 2009 to 2010 in the accessory platform includes a decrease in sales of digital converter boxes. Consolidated sales of converter
boxes were $33.7 million and $170.1 million in 2010 and 2009, respectively.
(2) Other sales include outside sales from repair services and outside sales of our global sourcing operations and domestic and overseas manufacturing
facilities.