Radio Shack 2010 Annual Report Download - page 38
Download and view the complete annual report
Please find page 38 of the 2010 Radio Shack annual report below. You can navigate through the pages in the report by either clicking on the pages listed below, or by using the keyword search tool below to find specific information within the annual report.-
 1
1 -
2
-
3
-
4
-
5
-
6
-
7
-
8
-
9
-
10
-
11
-
12
-
13
-
14
-
15
-
16
-
17
-
18
-
19
-
20
-
21
-
22
-
23
-
24
-
25
-
26
-
27
-
 28
28 -
 29
29 -
 30
30 -
 31
31 -
 32
32 -
 33
33 -
 34
34 -
 35
35 -
 36
36 -
 37
37 -
 38
38 -
 39
39 -
 40
40 -
 41
41 -
 42
42 -
 43
43 -
 44
44 -
 45
45 -
 46
46 -
 47
47 -
 48
48 -
49
-
50
-
51
-
52
-
53
-
54
-
55
-
56
-
57
-
58
-
59
-
60
-
61
-
62
-
63
-
64
-
65
-
66
-
67
-
68
-
69
-
70
-
71
-
72
-
73
-
74
-
75
-
76
-
77
-
78
-
79
-
80
-
81
-
82
-
83
-
84
-
85
-
86
-
87
-
88
 |
 |

28
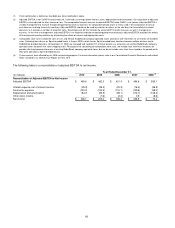
We believe free cash flow is a relevant indicator of our
ability to repay maturing debt, change dividend payments or
fund other uses of capital that management believes will
enhance shareholder value. The comparable financial
measure to free cash flow under generally accepted
accounting principles is cash flows from operating activities,
which was $155.0 million in 2010, $245.8 million in 2009,
and $274.6 million in 2008. We do not intend for the
presentation of free cash flow, a non-GAAP financial
measure, to be considered in isolation or as a substitute for
measures prepared in accordance with GAAP, nor do we
intend to imply that free cash flow represents cash flow
available for discretionary expenditures.
The following table is a reconciliation of cash flows from
operating activities to free cash flow.
Year Ended December 31,
(In millions) 2010 2009
2008
Net cash provided by
operating activities
$ 155.0
$ 245.8
$ 274.6
Less:
Additions to property, plant
and equipment
80.1
81.0
85.6
Dividends paid 26.5
31.3
31.3
Free cash flow $ 48.4
$ 133.5
$ 157.7
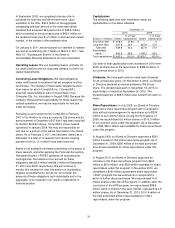
SOURCES OF LIQUIDITY
As of December 31, 2010, we had $569.4 million in cash
and cash equivalents. We believe that our cash flows from
operations and available cash and cash equivalents will
adequately fund our operations, our capital expenditures,
and our maturing debt obligations. Additionally, we had a
credit facility of $325 million.
On January 4, 2011, we terminated this credit facility and
entered into a new five-year, $450 million revolving credit
agreement (“2016 Credit Facility”) with a group of lenders
with Bank of America, N.A., as administrative agent.
As a condition of the 2016 Credit Facility, we were required
to eliminate the restrictive covenants associated with our
long-term notes due May 15, 2011 (as further defined
below, the “2011 Notes”). On January 4, 2011, we
transferred $318.1 million to the trustee for the 2011 Notes
that will be used to pay principal and interest amounts due
upon redemption of these notes. In connection with the
deposit of these funds, the trustee acknowledged the
satisfaction and discharge of the indenture as to the 2011
Notes, which had the effect of eliminating the restrictive
covenants referred to above. This redemption is currently
scheduled to take place on March 4, 2011. Any amounts
remaining with the trustee after the redemption of the 2011
Notes will be returned to us.
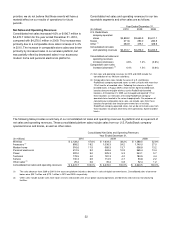
The table below lists our credit commitments from various financial institutions at December 31, 2010.
(In millions) Commitment Expiration per Period
Credit Commitments
Total Amounts
Committed
Less Than
1 Year
1-3 Years
3-5 Years
Over
5 Years
Lines of credit
(1)
$325.0 $325.0 $ -- $ -- $ --
Standby letters of credit -- -- -- -- --
Total commercial commitments $325.0 $325.0 $ -- $ -- $ --
(1) On January 4, 2011, we replaced this credit facility with a new five-year, $450 million credit facility. See the “Available Financing” section below for more
information.
Available Financing: As of December 31, 2010, we had
$292.3 million in borrowing capacity available under our
existing credit facility. We did not borrow under this facility
during 2010, but we did arrange for the issuance of standby
letters of credit totaling $32.7 million under the facility. This
credit facility had customary terms and covenants, and we
were in compliance with these covenants at December 31,
2010. The facility was scheduled to expire in May of 2011.
The 2016 Credit Facility expires on January 4, 2016. The
new facility may be used for general corporate purposes
and the issuance of letters of credit. The new facility is
secured by substantially all of the Company’s inventory,
accounts receivable, cash and cash equivalents, and
certain other personal property.
Borrowings under the 2016 Credit Facility are subject to a
borrowing base of certain secured assets and bear interest,
at our option, at a bank’s prime rate plus 1.25% to 1.75% or
LIBOR plus 2.25% to 2.75%. The applicable rates in these
ranges are based on the aggregate average availability
under the facility.
The 2016 Credit Facility also contains a $150 million sub-
limit for the issuance of standby and commercial letters of
credit. Issued letters of credit will reduce the amount
available under the facility. Letter of credit fees are 2.25%