Quest Diagnostics 2012 Annual Report Download - page 98
Download and view the complete annual report
Please find page 98 of the 2012 Quest Diagnostics annual report below. You can navigate through the pages in the report by either clicking on the pages listed below, or by using the keyword search tool below to find specific information within the annual report.-
 1
1 -
2
-
3
-
4
-
5
-
6
-
7
-
8
-
9
-
10
-
11
-
12
-
13
-
14
-
15
-
16
-
17
-
18
-
19
-
20
-
21
-
22
-
23
-
24
-
25
-
26
-
27
-
28
-
29
-
30
-
31
-
32
-
33
-
34
-
35
-
36
-
37
-
38
-
39
-
40
-
41
-
42
-
43
-
44
-
45
-
46
-
47
-
48
-
49
-
50
-
51
-
52
-
53
-
54
-
55
-
56
-
57
-
58
-
59
-
60
-
61
-
62
-
63
-
64
-
65
-
66
-
67
-
68
-
69
-
70
-
71
-
72
-
73
-
74
-
75
-
76
-
77
-
78
-
79
-
80
-
81
-
82
-
83
-
84
-
85
-
86
-
87
-
 88
88 -
 89
89 -
 90
90 -
 91
91 -
 92
92 -
 93
93 -
 94
94 -
 95
95 -
 96
96 -
 97
97 -
 98
98 -
 99
99 -
 100
100 -
 101
101 -
 102
102 -
 103
103 -
 104
104 -
 105
105 -
 106
106 -
 107
107 -
 108
108 -
109
-
110
-
111
-
112
-
113
-
114
-
115
-
116
-
117
-
118
-
119
-
120
-
121
-
122
-
123
-
124
-
125
-
126
 |
 |

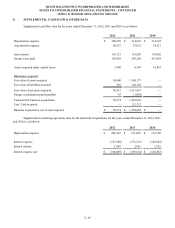
F- 25
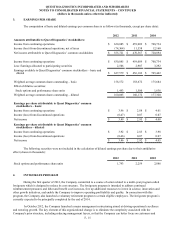
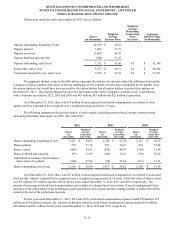
8. SUPPLEMENTAL CASH FLOW & OTHER DATA
Supplemental cash flow data for the years ended December 31, 2012, 2011 and 2010 is as follows:
2012 2011 2010
Depreciation expense $ 206,299 $ 214,070 $ 214,743
Amortization expense 80,297 67,032 39,221
Interest paid 163,121 161,820 139,802
Income taxes paid 305,428 285,269 421,864
Assets acquired under capital leases 5,580 8,369 18,818
Businesses acquired:
Fair value of assets acquired 50,800 1,560,173 —
Fair value of liabilities assumed 269 148,192 —
Fair value of net assets acquired 50,531 1,411,981 —
Merger consideration paid (payable) 43 (1,045)—
Cash paid for business acquisitions 50,574 1,410,936 —
Less: Cash acquired — 112,312 —
Business acquisitions, net of cash acquired $ 50,574 $ 1,298,624 $ —
Supplemental continuing operations data for the statement of operations for the years ended December 31, 2012, 2011
and 2010 is as follows:
2012 2011 2010
Depreciation expense $ 203,542 $ 211,052 $ 213,190
Interest expense (167,688)(172,215)(145,029)
Interest income 2,999 2,601 1,562
Interest expense, net $ (164,689)$ (169,614)$ (143,467)
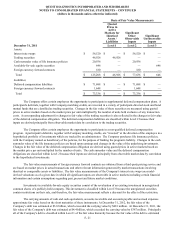
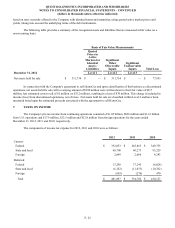
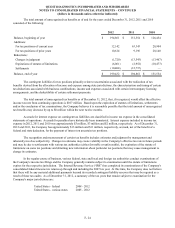
QUEST DIAGNOSTICS INCORPORATED AND SUBSIDIARIES
NOTES TO CONSOLIDATED FINANCIAL STATEMENTS – CONTINUED
(dollars in thousands unless otherwise indicated)