Quest Diagnostics 2012 Annual Report Download - page 117
Download and view the complete annual report
Please find page 117 of the 2012 Quest Diagnostics annual report below. You can navigate through the pages in the report by either clicking on the pages listed below, or by using the keyword search tool below to find specific information within the annual report.-
 1
1 -
2
-
3
-
4
-
5
-
6
-
7
-
8
-
9
-
10
-
11
-
12
-
13
-
14
-
15
-
16
-
17
-
18
-
19
-
20
-
21
-
22
-
23
-
24
-
25
-
26
-
27
-
28
-
29
-
30
-
31
-
32
-
33
-
34
-
35
-
36
-
37
-
38
-
39
-
40
-
41
-
42
-
43
-
44
-
45
-
46
-
47
-
48
-
49
-
50
-
51
-
52
-
53
-
54
-
55
-
56
-
57
-
58
-
59
-
60
-
61
-
62
-
63
-
64
-
65
-
66
-
67
-
68
-
69
-
70
-
71
-
72
-
73
-
74
-
75
-
76
-
77
-
78
-
79
-
80
-
81
-
82
-
83
-
84
-
85
-
86
-
87
-
88
-
89
-
90
-
91
-
92
-
93
-
94
-
95
-
96
-
97
-
98
-
99
-
100
-
101
-
102
-
103
-
104
-
105
-
106
-
 107
107 -
 108
108 -
 109
109 -
 110
110 -
 111
111 -
 112
112 -
 113
113 -
 114
114 -
 115
115 -
 116
116 -
 117
117 -
 118
118 -
 119
119 -
 120
120 -
 121
121 -
 122
122 -
 123
123 -
 124
124 -
 125
125 -
 126
126
 |
 |

F- 44
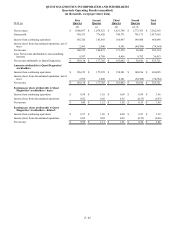
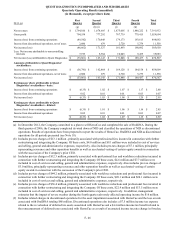
2012 2011 2010
Net revenues:
DIS business (a) $ 6,819,916 $ 6,811,722 $ 6,736,840
All other operating segments (a) 562,646 580,210 523,280
Total net revenues $ 7,382,562 $ 7,391,932 $ 7,260,120
Operating earnings (loss):
DIS business (a) $ 1,385,664 $ 1,405,720 $ 1,429,893
All other operating segments (a) 57,246 52,549 20,534
General corporate expenses (242,113)(471,628)(166,844)
Total operating income 1,200,797 986,641 1,283,583
Non-operating expenses, net (132,402)(137,847)(108,599)
Income from continuing operations before taxes 1,068,395 848,794 1,174,984
Income tax expense 401,897 354,702 430,127
Income from continuing operations 666,498 494,092 744,857
Income (loss) from discontinued operations, net of taxes (74,364) 11,558 12,160
Net income 592,134 505,650 757,017
Less: Net income attributable to noncontrolling interests 36,413 35,083 36,123
Net income attributable to Quest Diagnostics $ 555,721 $ 470,567 $ 720,894
2012 2011 2010
Depreciation and amortization:
DIS business (a) $ 183,698 $ 189,796 $ 194,509
All other operating segments (a) 17,284 18,433 16,049
General corporate 77,308 64,006 35,745
278,290 272,235 246,303
Adjustments: Discontinued operations 8,306 8,867 7,661
Total depreciation and amortization $ 286,596 $ 281,102 $ 253,964
Capital expenditures:
DIS business (a) $ 145,165 $ 132,021 $ 166,329
All other operating segments (a) 24,458 20,276 27,236
General corporate 11,151 6,826 9,152
180,774 159,123 202,717
Adjustments: Discontinued operations 1,460 2,433 2,683
Total capital expenditures $ 182,234 $ 161,556 $ 205,400
(a) - DIS excludes the results for OralDNA, and all other operating segments excludes the results of HemoCue, which have met
the criteria for discontinued operations and, accordingly, are included in discontinued operations for all periods presented.
20. SUBSEQUENT EVENTS
On January 2, 2013, the Company completed the acquisition of the clinical and anatomic pathology outreach
laboratory businesses of UMass Memorial Medical Center, a member of UMass Memorial Health Care.
QUEST DIAGNOSTICS INCORPORATED AND SUBSIDIARIES
NOTES TO CONSOLIDATED FINANCIAL STATEMENTS – CONTINUED
(dollars in thousands unless otherwise indicated)