Quest Diagnostics 2012 Annual Report Download - page 69
Download and view the complete annual report
Please find page 69 of the 2012 Quest Diagnostics annual report below. You can navigate through the pages in the report by either clicking on the pages listed below, or by using the keyword search tool below to find specific information within the annual report.-
 1
1 -
2
-
3
-
4
-
5
-
6
-
7
-
8
-
9
-
10
-
11
-
12
-
13
-
14
-
15
-
16
-
17
-
18
-
19
-
20
-
21
-
22
-
23
-
24
-
25
-
26
-
27
-
28
-
29
-
30
-
31
-
32
-
33
-
34
-
35
-
36
-
37
-
38
-
39
-
40
-
41
-
42
-
43
-
44
-
45
-
46
-
47
-
48
-
49
-
50
-
51
-
52
-
53
-
54
-
55
-
56
-
57
-
58
-
 59
59 -
 60
60 -
 61
61 -
 62
62 -
 63
63 -
 64
64 -
 65
65 -
 66
66 -
 67
67 -
 68
68 -
 69
69 -
 70
70 -
 71
71 -
 72
72 -
 73
73 -
 74
74 -
 75
75 -
 76
76 -
 77
77 -
 78
78 -
 79
79 -
80
-
81
-
82
-
83
-
84
-
85
-
86
-
87
-
88
-
89
-
90
-
91
-
92
-
93
-
94
-
95
-
96
-
97
-
98
-
99
-
100
-
101
-
102
-
103
-
104
-
105
-
106
-
107
-
108
-
109
-
110
-
111
-
112
-
113
-
114
-
115
-
116
-
117
-
118
-
119
-
120
-
121
-
122
-
123
-
124
-
125
-
126
 |
 |
66
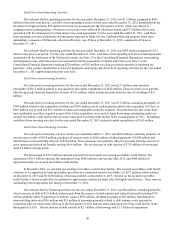
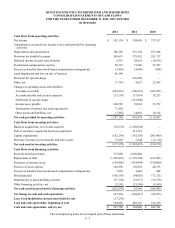
Cash Flows from Operating Activities
Net cash provided by operating activities for the year ended December 31, 2012 was $1.2 billion compared to $895
million in the prior year period. Cash flows from operating activities for the year ended December 31, 2012 benefited from the
the deferral of approximately $70 million of income tax payments into the first quarter of 2013, which was offered to
companies whose principal place of business was in states most affected by Hurricane Sandy, and $72 million of proceeds
associated with the termination of certain interest rate swap agreements. For the year ended December 31, 2011, cash flows
from operating activities included the second quarter payment to Medi-Cal, the California Medicaid program. Days sales
outstanding, a measure of billing and collection efficiency, was 47 days at December 31, 2012, compared to 45 days at
December 31, 2011.
Net cash provided by operating activities for the year ended December 31, 2011 was $895 million compared to $1.1
billion in the prior year period. For the year ended December 31, 2011, cash flows from operating activities included payments
associated with the settlement of the California Lawsuit (see Note 17 to the Consolidated Financial Statements), restructuring
and integration costs, and transaction costs associated with the acquisitions of Athena and Celera (see Note 5 to the
Consolidated Financial Statements) totaling $320 million, or $202 million net of an associated reduction in estimated tax
payments. After giving consideration to these net payments, underlying cash flows from operating activities for the year ended
December 31, 2011 approximated the prior year level.
Cash Flows from Investing Activities
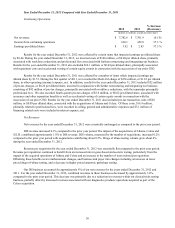
Net cash used in investing activities for the year ended December 31, 2012 was $217 million, and consisted
principally of $50.5 million related to an acquisition and capital expenditures of $182 million. These decreases were partially
offset by proceeds from the disposition of assets of $15 million, which include proceeds from the sale of a building of $12
million.
Net cash used in investing activities for the year ended December 31, 2011 was $1.2 billion, consisting principally of
$740 million related to the acquisition of Athena and $556 million, net of cash acquired related to the acquisition of Celera, or
$343 million, net of cash and $213 million of short-term marketable securities acquired. Proceeds from the sale of the short-
term marketable securities, acquired as part of the Celera acquisition, were used to repay borrowings outstanding under our
secured receivables credit facility and our senior unsecured revolving credit facility in the second quarter of 2011. In addition,
cash flows from investing activities for the year ended December 31, 2011 included capital expenditures of $162 million.
Cash Flows from Financing Activities
Net cash used in financing activities for the year ended December 31, 2012 was $822 million, consisting primarily of
net decreases in debt of $654 million, purchases of treasury stock of $200 million, dividend payments of $108 million and
distributions to noncontrolling interests of $38 million. These decreases were partially offset by proceeds from the exercise of
stock options and related tax benefits totaling $166 million. The net decrease in debt consists of $715 million of borrowings
and $1.4 billion of repayments.
The borrowings of $715 million represent amounts borrowed under our secured receivables credit facility. The
repayments of $1.4 billion represent the repayment of our $560 million term loan due May 2012, and $800 million of
repayments under our secured receivables credit facility.
In December 2012, we extended our existing receivables securitization facility. The secured receivables credit facility
continues to be supported by back-up facilities provided on a committed basis by two banks: (a) $275 million, which matures
on December 6, 2013 and (b) $250 million, which also matures on December 6, 2013. Interest on the secured receivables
credit facility is based on rates that are intended to approximate commercial paper rates for highly-rated issuers. There were no
outstanding borrowings under this facility at December 31, 2012.
Net cash provided by financing activities for the year ended December 31, 2011 was $64 million, consisting primarily
of net increases in debt of $1.0 billion, and proceeds from the exercise of stock options and related tax benefits totaling $141
million, partially offset by purchases of treasury stock of $935 million, dividend payments of $65 million, distributions to
noncontrolling interests of $36 million and $13 million of payments primarily related to debt issuance costs incurred in
connection with our senior notes offering in the first quarter of 2011 and our senior unsecured revolving credit facility in the
third quarter of 2011. The net increase in debt consists of $2.7 billion of borrowings and $1.7 billion of repayments.